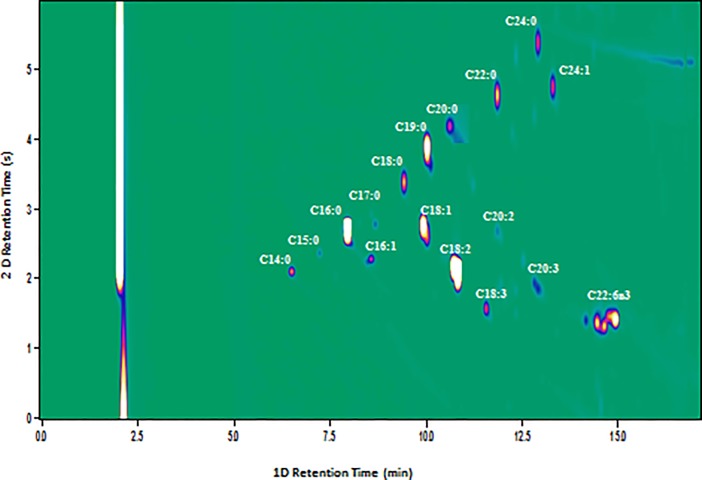
Fig 1. Contour plot showing fatty acid profile of safflower oil analysed by GC×GC-FID (Comprehensive two dimensional gas chromatography equipped with flame ionization detector) on SLB-IL111/IL-59 column set.
It showed retention time on one dimensional (minutes) and two dimensional (seconds) column set. C14:0 (Myristic acid), C15:0 (Pentadecylic acid), C16:0 (Palmitic acid), C16:1 (Palmitoleic acid), C17:0 (Margaric acid), C18:0 (Stearic acid), C18:1 (Oleic acid), C18:2 Linoleic acid), C18:3 (Linolenic acid), C19:0 (Nonadecylic acid), C20:0 (Arachidic acid), C20:2 (Eicosadienoic acid), C20:3 (Eicosatrienoic acid), C22:0 (Behenic acid), C22:6n3 (Docosahexaenoic acid), C24:0 (Lingoceric acid), C24:1 (Nervonic acid).

