
Fig 4. 90–90 estimates for the total population, at the start and end of Round 2.
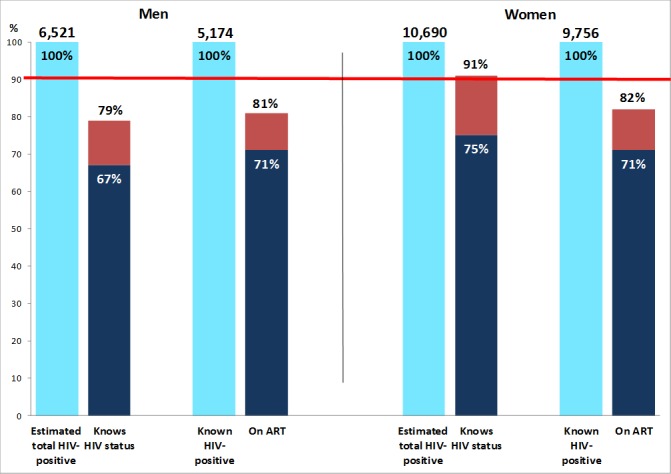
Dark blue bars show the estimated percentage of HIV+ individuals who knew their HIV+ status (first 90 target) and the estimated percentage who were on ART among those who knew their HIV+ status (second 90 target), immediately prior to the Round 2 annual visit. Red bars show the same estimated percentages, by the end of Round 2. ART, antiretroviral therapy.