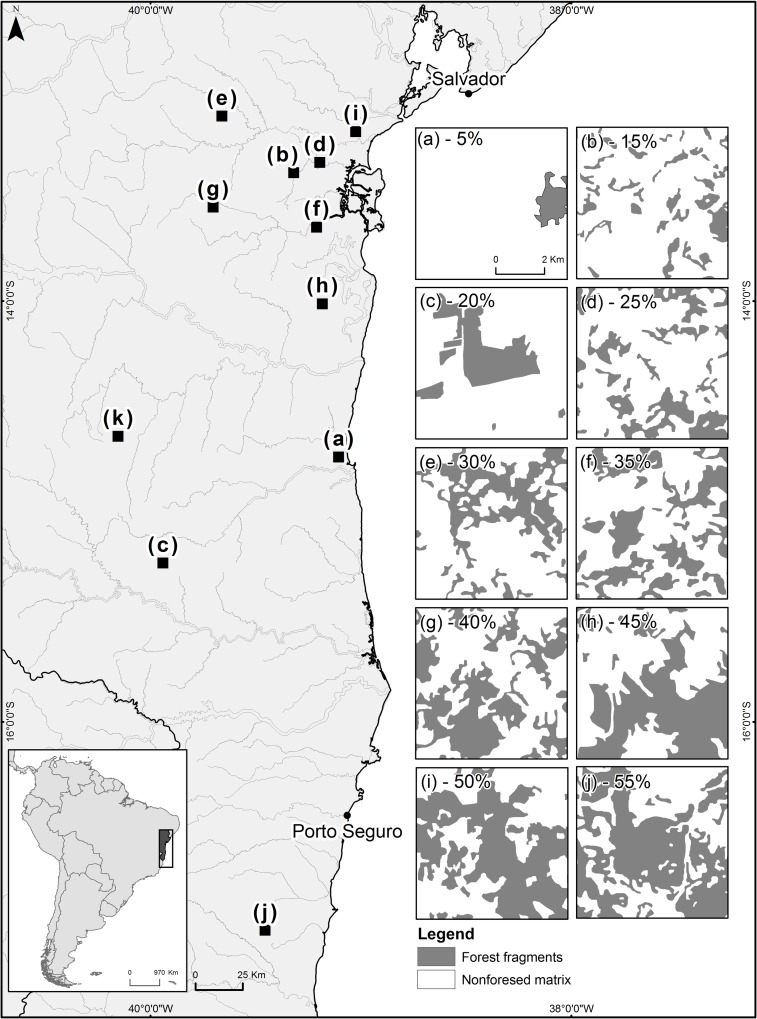
Fig 1. Map of the study area in the state of Bahia, north-eastern Brazil.
In detail, at the bottom left, a map of Brazil indicating the region of the study area. The large image on the left side shows the geographical positions of the landscapes sampled along the eastern region of the state of Bahia and its refuge (dark grey) and non-refuge (light grey) areas. On the right side are the 10 fragmented landscapes with different percentages of remaining forest (grey areas) represented by the following letters: (a) 5% forest habitat, (b) 15%, (c) 20%, (d) 25%, (e) 30%, (f) 35%, (g) 40%, (h) 45%, (i) 50%, (j) 55%.

