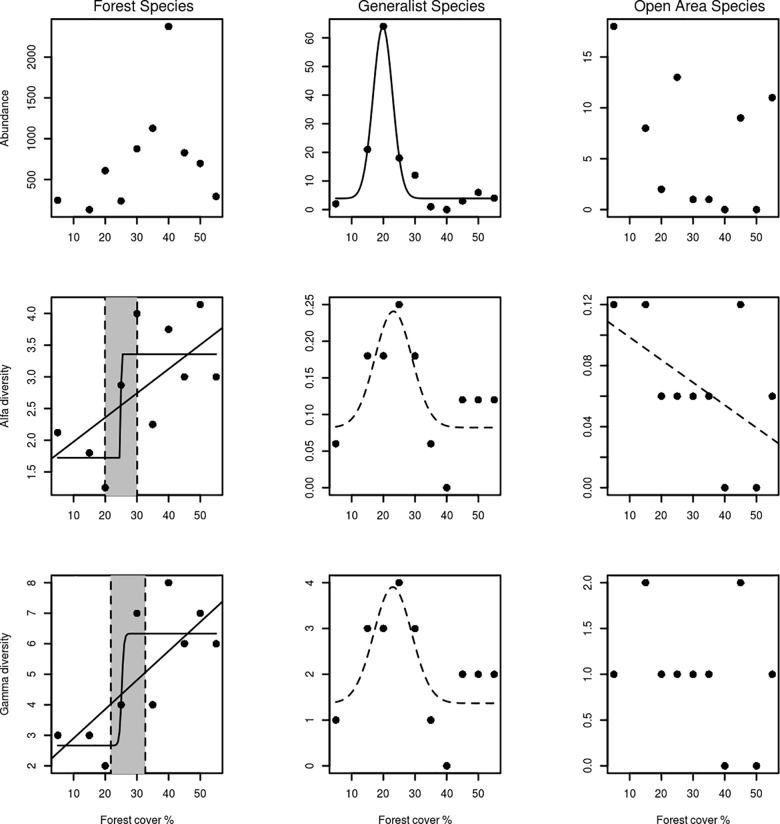
Fig 4. Abundance, alpha diversity and gamma diversity of dung beetle groups across landscapes with different amount of forest cover.
Solid lines correspond to the best-fitted models. Dashed lines correspond to models that fit equally to the null model. The grey area corresponds to the confidence interval around the threshold value.

