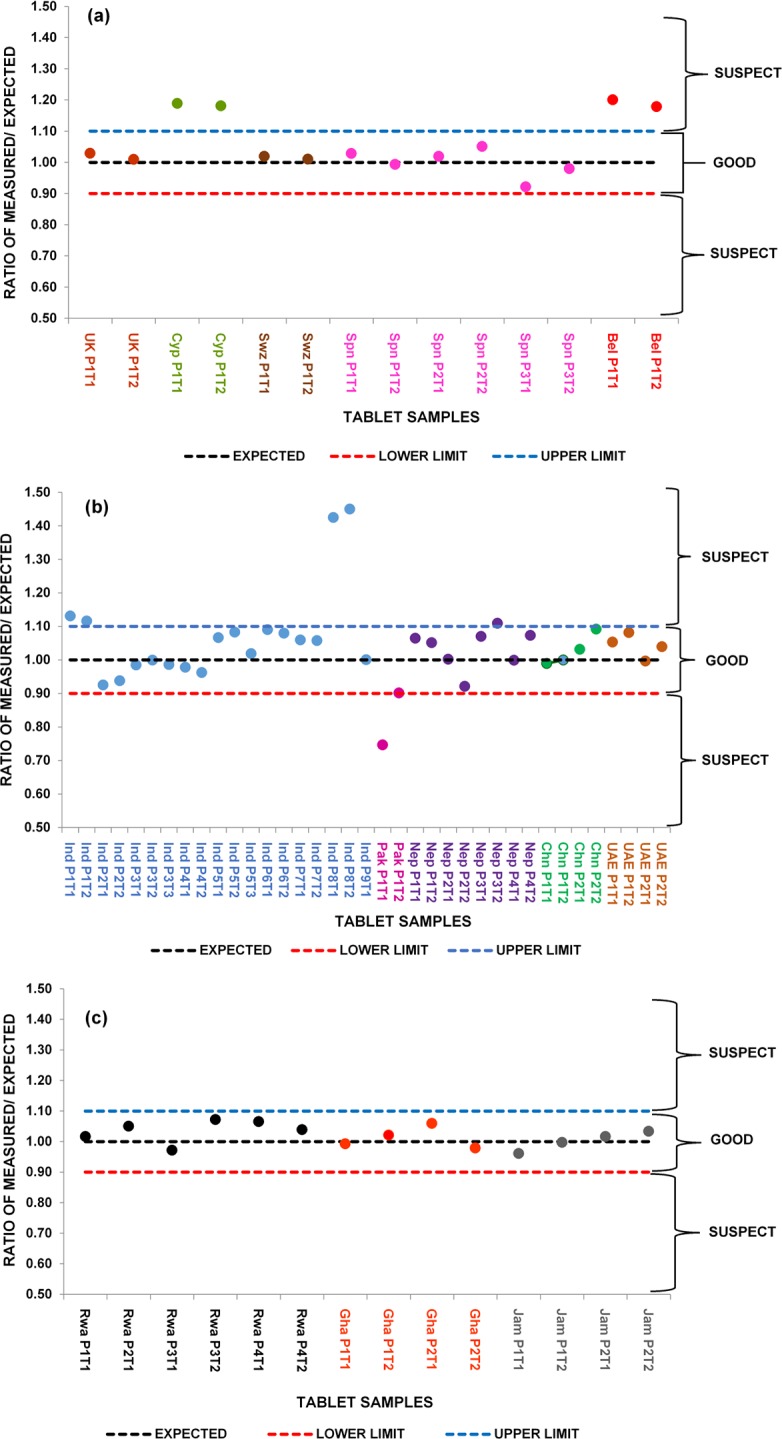
Fig 7.

Ratio of measured to expected amounts of Paracetamol in tablet samples from around the world based on calibration for peak over the range 1524-1493cm-1 (centred at 1505cm-1): (a) Ratio of measured to expected amounts of Paracetamol in 14 samples of tablets from around Europe, (b) Ratio of measured to expected amounts of Paracetamol in 37 samples of tablets from Asia and Middle East, (c) Ratio of measured to expected amounts of Paracetamol in 14 samples of tablets from around Africa and the Caribbean Islands.
