
Figure 10. Heatmap of CMT neuropathy and pain channelopathy gene expression levels across neural and non-neural tissues.
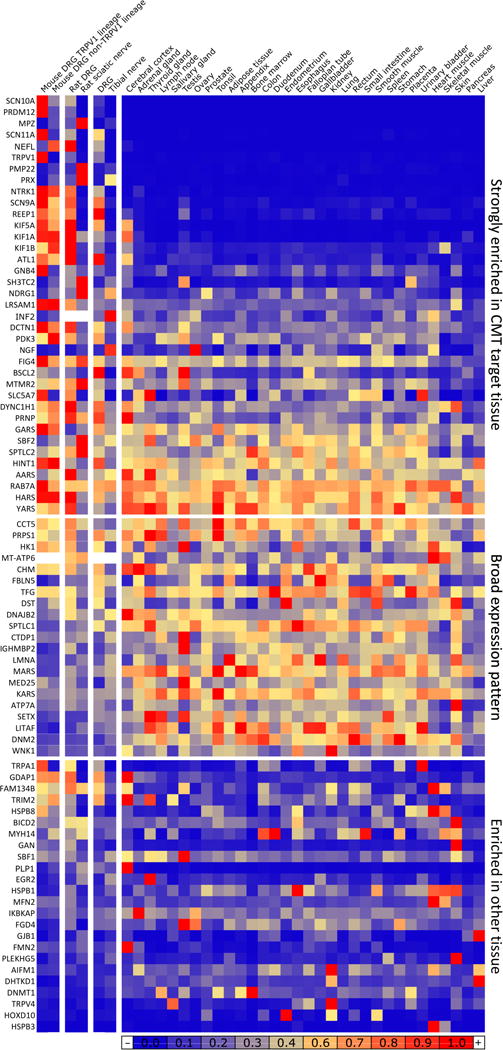
CMT and neuropathy genes were normalized to a % of maximum expression and colored according to numeric value. Sorting of the matrix was performed by segregating values into several classes. Genes in the top group are most highly expressed in DRG, neurons, or nerve/Schwann cell-containing tissues (first six columns), while genes in the lower two groups have higher level of expression in at least one tissue. The remaining genes were divided into homogeneous (middle) or punctate (bottom) levels of expression. All three groups were sorted for enrichment in first six columns.