
Figure 3. Summary statistics and differential gene expression between DRG and sciatic nerve.
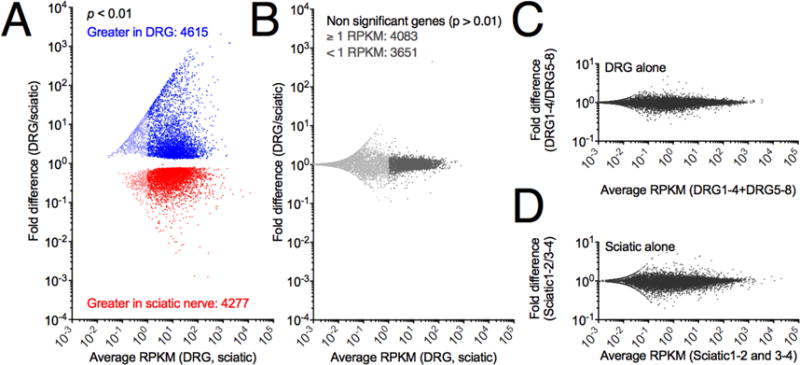
Significance of differential expression was calculated from raw reads using DESEQ (R, Bioconductor) normalization and testing. Separately, RPKM values were calculated as an abundance estimate. A. All genes were plotted according to average RPKM between the two tissues examined and fold difference (DRG/sciatic). Significantly differentially expressed genes (p < .01) are colored by enrichment in the DRG (blue) or sciatic (red), with genes below 1 RPKM shown in a lighter shade. In general large fold change genes and highly expressed genes were significant with 4615 genes enriched in the DRG and 4277 genes enriched in the sciatic nerve. B Non-significant genes using the same color scheme to denote genes below 1 RPKM, which are in general more variable than more highly expressed genes. C, D. Control plots of average expression vs fold change expression were generated by dividing each group of samples into two halves, and plotting them against each other, and are plotted on the same Y-axis scale as in the cross-tissue comparions. Panels C and D span 2 orders of magnitude differential expression, whereas panel A spans >7.