
Figure 9. Summary of transcriptomic data for CMT neuropathies and nociception-related genes.
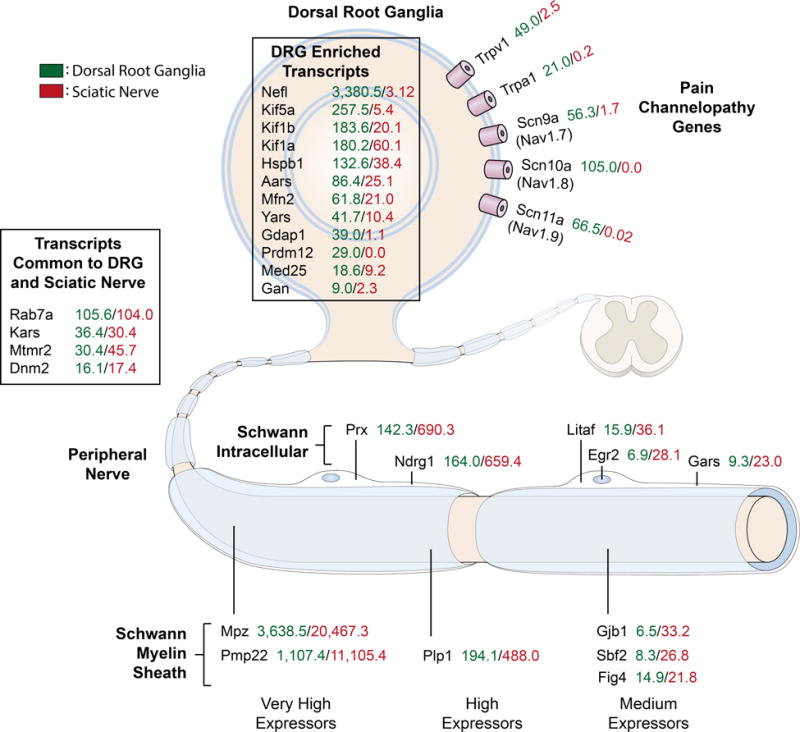
This figure was adapted from Rossor, et al (2013) with the addition of quantitative data (RPKM values) from transcriptomics experiments. This provides a quantitative measure of the level of expression of these genes between the two major tissues involved in CMT and nociception. In general these genes can be divided into the sciatic nerve/Schwann cell enriched population and the DRG population.