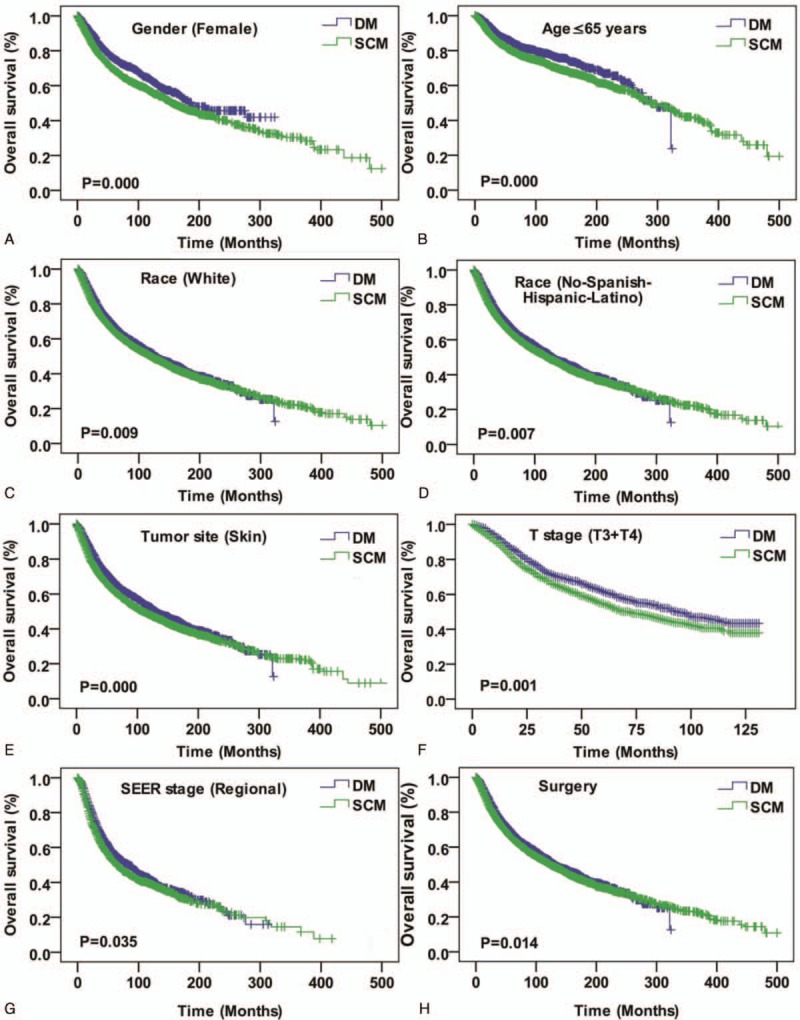
Figure 2.

Kaplan–Meier curves for overall survival compared by sex (female) (A), age (age ≤65 years) (B), race (white) (C), race (No-Spanish-Hispanic-Latino) (D), rumor site (skin) (E), T stage (T3 + T4), SEER historic stage (regional tumor) (G), and surgery (H). SEER = the Surveillance, Epidemiology, and End Results.
