
Figure 4.
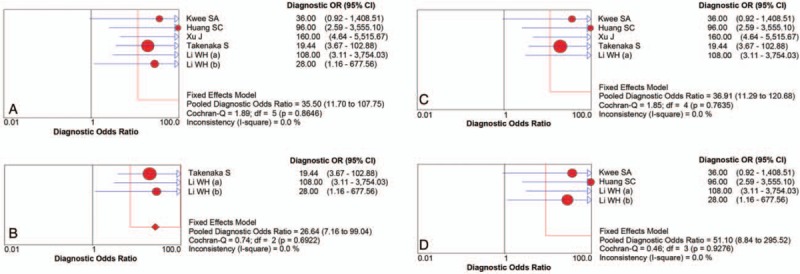
Forest plot of the DOR with the 95% confidence interval of the overall group (A) and each subgroup (B–D). df = degrees of freedom.
Official websites use .gov
A
.gov website belongs to an official
government organization in the United States.
Secure .gov websites use HTTPS
A lock (
) or https:// means you've safely
connected to the .gov website. Share sensitive
information only on official, secure websites.
Forest plot of the DOR with the 95% confidence interval of the overall group (A) and each subgroup (B–D). df = degrees of freedom.