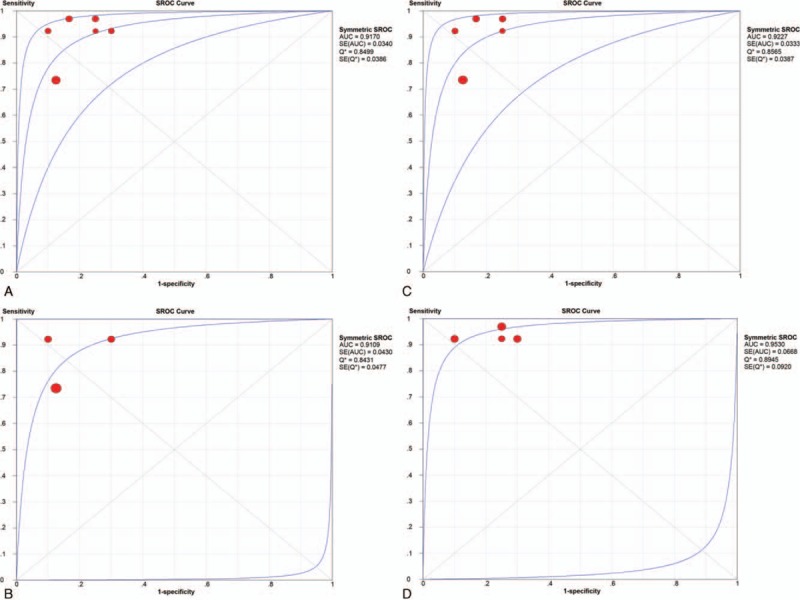
Figure 5.

Summary receiver operating characteristic curve of the overall group (A) and each subgroup (B–D). AUC = area under the curve, SE = standard error.

Summary receiver operating characteristic curve of the overall group (A) and each subgroup (B–D). AUC = area under the curve, SE = standard error.