
Figure 4.
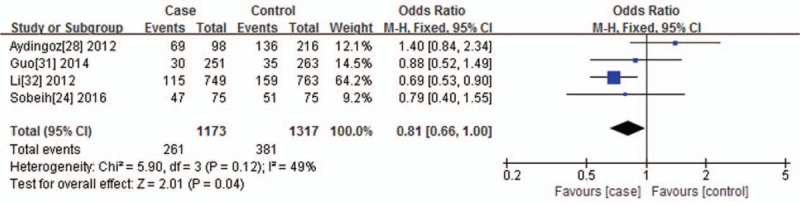
Forest plot of the association between the VDR TaqI polymorphisms and vitiligo under the dominant genetic model (CC+CT vs TT). The horizontal lines correspond to the study-specific OR and 95% CI, respectively. The area of the squares reflects the study-specific weight. The diamond represents the pooled results of the OR and the 95% CI.