
Figure 6.
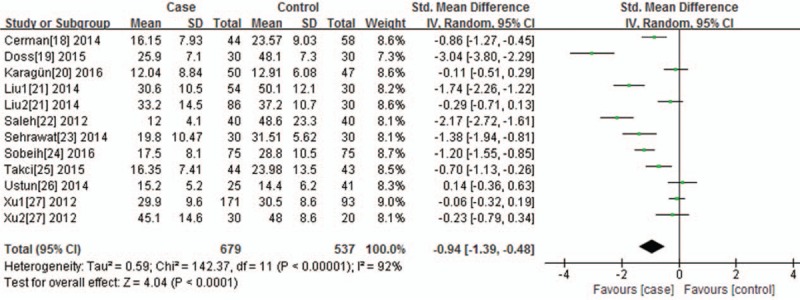
Forest plot of the association between serum 25-(OH) D level and vitiligo, the horizontal lines correspond to the study-specific SMD and 95% CI, respectively. The area of the squares reflects the study-specific weight. The diamond represents the pooled results of SMD and 95%CI.