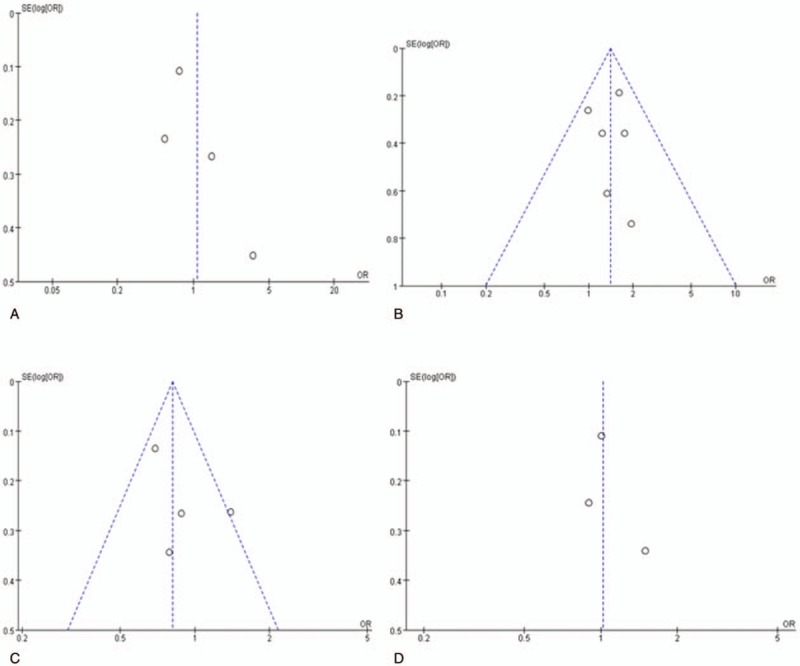
Figure 7.

Funnel plot for the publication bias tests. Each point represents a separate study for the indicated association. The horizontal and vertical axis correspond to the OR and confidence limits (OR: odds ratio, SE: standard error). A, VDR BsmI polymorphism and vitiligo under the dominant genetic model (AA+AG vs GG); (B) VDR ApaI polymorphism and vitiligo under the dominant genetic model (CC+AC vs AA); (C) VDR TaqI polymorphism and vitiligo under the dominant genetic model (CC+CT vs TT). (D) VDR FokI polymorphism and vitiligo under the dominant genetic model (TT+TC vs CC).
