Figure 8.

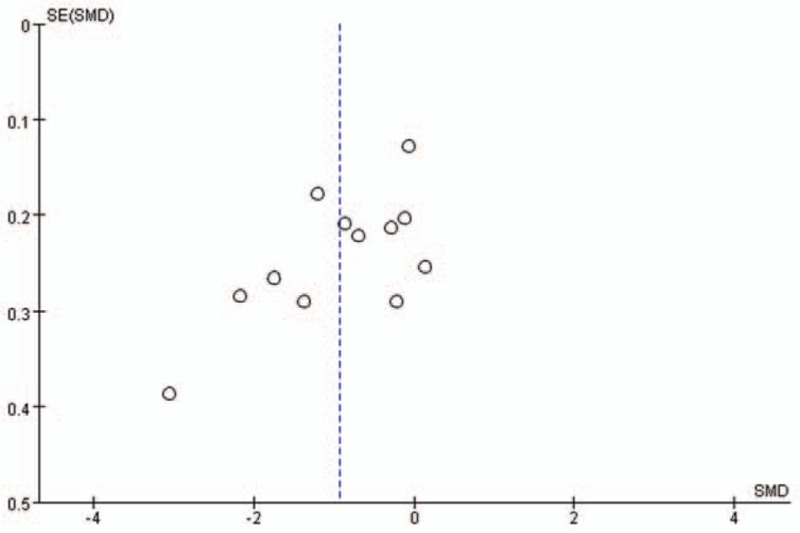
Funnel plot for the publication bias tests of serum 25-(OH) D level and vitiligo. The horizontal and vertical axis correspond to the SMD and confidence limits (SE = standard error, SMD = standard mean difference).

Funnel plot for the publication bias tests of serum 25-(OH) D level and vitiligo. The horizontal and vertical axis correspond to the SMD and confidence limits (SE = standard error, SMD = standard mean difference).