
Figure 8.
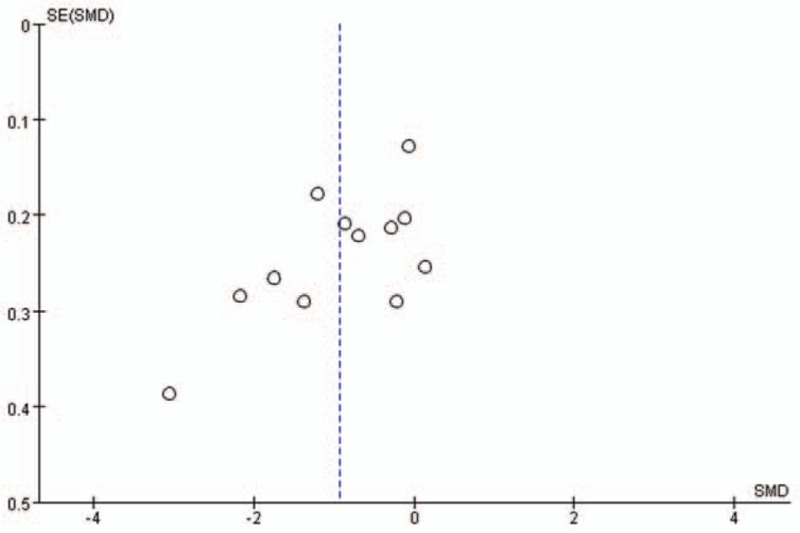
Funnel plot for the publication bias tests of serum 25-(OH) D level and vitiligo. The horizontal and vertical axis correspond to the SMD and confidence limits (SE = standard error, SMD = standard mean difference).
Official websites use .gov
A
.gov website belongs to an official
government organization in the United States.
Secure .gov websites use HTTPS
A lock (
) or https:// means you've safely
connected to the .gov website. Share sensitive
information only on official, secure websites.
Funnel plot for the publication bias tests of serum 25-(OH) D level and vitiligo. The horizontal and vertical axis correspond to the SMD and confidence limits (SE = standard error, SMD = standard mean difference).