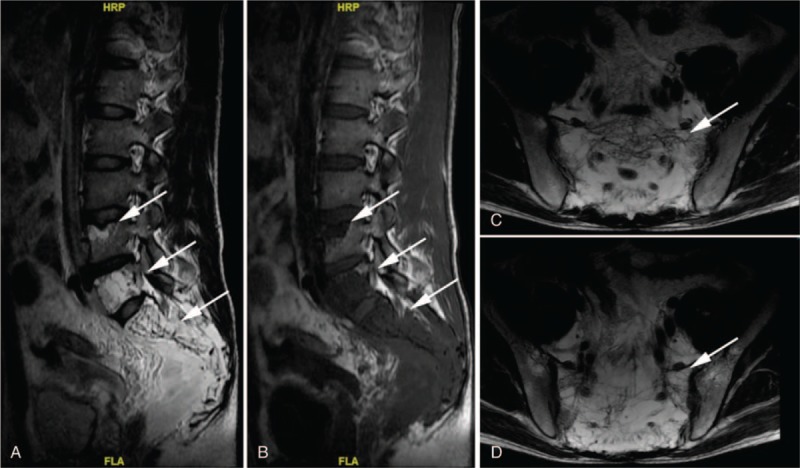
Figure 1.

A, B, Sagittal plane of the MRI scan revealed bony destruction of L4, L5 and sacrum appeared high signal intensity on T2 images and low signal intensity on T1 images. C, D Transverse plane of the MRI scan showed bony destruction of L4, L5 and sacrum appeared high signal intensity on T2 images.
