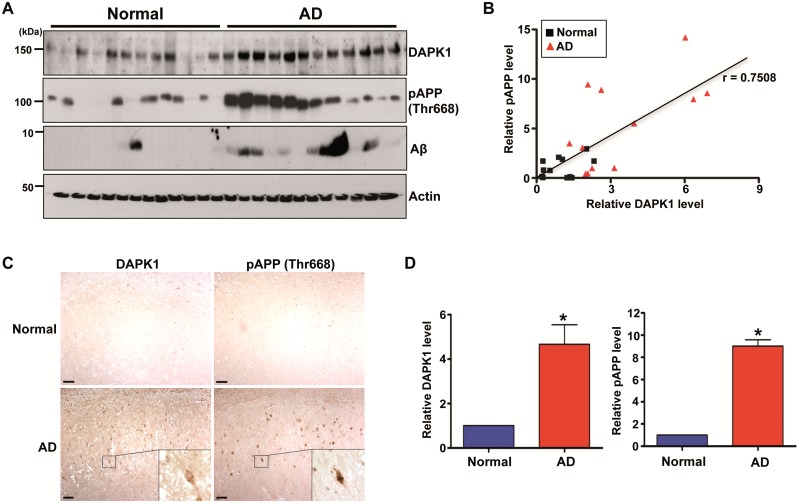
Figure 8.
The expression of DAPK1, APP phosphorylation at Thr668, and Aβ in the AD patient and normal brains. (A, B) Hippocampal tissues of 12 AD patients and 12 age-matched normal controls were harvested. (A) Proteins from normal and AD hippocampus were used for immunoblotting with anti-DAPK1, anti-pThr668-APP, anti-Aβ or anti-actin antibody. The blots are representative of three independent experiments. (B) Linear regression analysis was used to estimate the correlation between DAPK1 expression and APP phosphorylation at Thr668 (r = 0.7508; Pearson's correlation coefficient). (C) Immunohistochemistry using a monoclonal antibody specific for DAPK1 or a polyclonal antibody specific for phosphorylated APP at Thr668 was conducted on hippocampal regions from AD patient and normal control. ×100 (main photographs); ×400 (insets); scale bar = 50 μm. Representative images from five experiments are shown. (D) Quantitation of DAPK1 and pThr668 APP. Results shown are mean ± standard error (*P < 0.05; ANOVA/Dunnett’s test).

