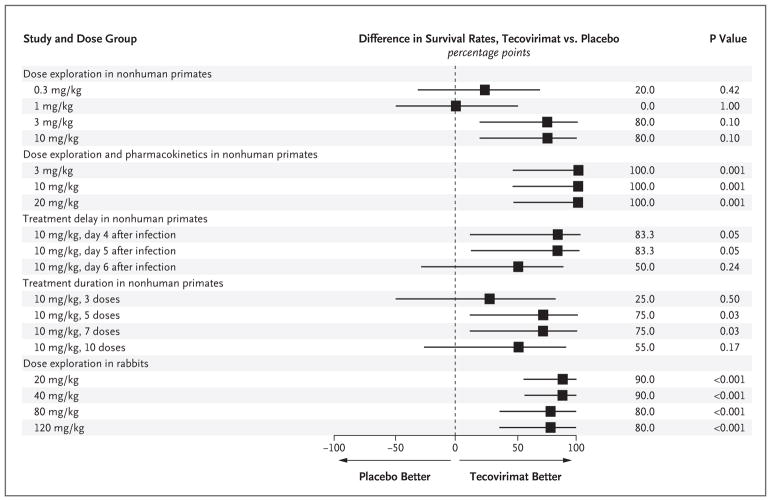
Figure 2. Differences in Survival Rates with Tecovirimat as Compared with Placebo.
Shown is a forest-plot summary comparing differences in survival rates between tecovirimat and placebo in each study. The exact 95% confidence intervals (horizontal bars in the forest plot) are based on the score statistic of the difference in survival rates. The P value is from a one-sided Fisher’s exact test for the comparison of tecovirimat with placebo. Data from the study of dose exploration and pharmacokinetics in rabbits are not shown on the forest plot, since the study did not include a placebo control.

