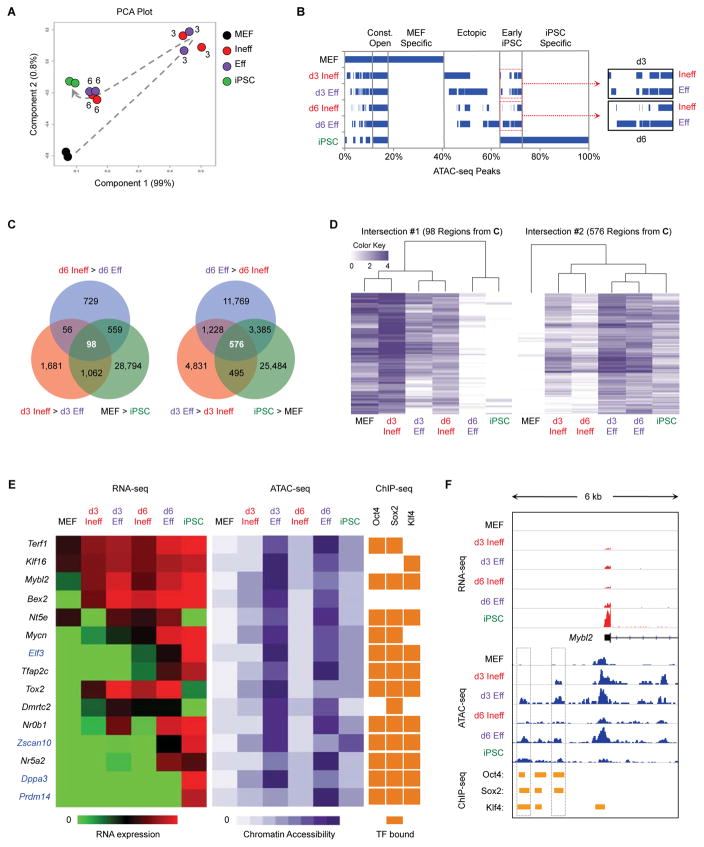
Figure 6. Eff Intermediates Rapidly Acquire Regions of Chromatin Hyperaccessibility.
(A) ATAC-seq was performed on the indicated populations in duplicate. Shown is a PCA based on peaks identified in MEFs. Numbers indicate the reprogramming time point of intermediates. The dotted arrow indicates the proposed trajectory of chromatin accessibility changes during reprogramming.
(B) Overlap of ATAC-seq peaks between populations. The percentage of total peaks for every possible combination of overlap is shown. Blue bars represent the presence of peaks in the indicated population(s), whereas white denotes the absence of peaks.
(C) Venn diagram showing the overlap of d3 DARs (comparing d3 Ineff and d3 Eff cells) and d6 DARs (comparing d6 Ineff and d6 Eff cells) and DARs between MEFs and iPSCs (Table S3).
(D) Heatmaps with hierarchical clustering shown for the indicated sets of DARs from Figure 6C. White bars indicate regions of closed chromatin and darker bars indicate regions with greater chromatin accessibility.
(E) Correlation between gene expression, chromatin accessibility, and TF binding. Regions were selected from Intersection #2 (576 ATAC-seq peaks, Figure 6C) and associated with the closest gene (Table S3). Shown are heatmaps for RNA-seq (left); ATAC-seq (middle); and published ChIP-seq for OKS binding in ESCs (Chronis et al., 2017) (right). For genes highlighted in blue, chromatin accessibility precedes transcription.
(F) Genome browser view of RNA-seq (red) ATAC-seq (blue) and ChIP-seq (orange) for the region adjacent to Mybl2. Boxes denote areas that are more differentially open by ATAC-seq in d3 Eff, d6 Eff, and iPSCs compared to d3 Ineff, d6 Ineff, and MEFs, respectively.

