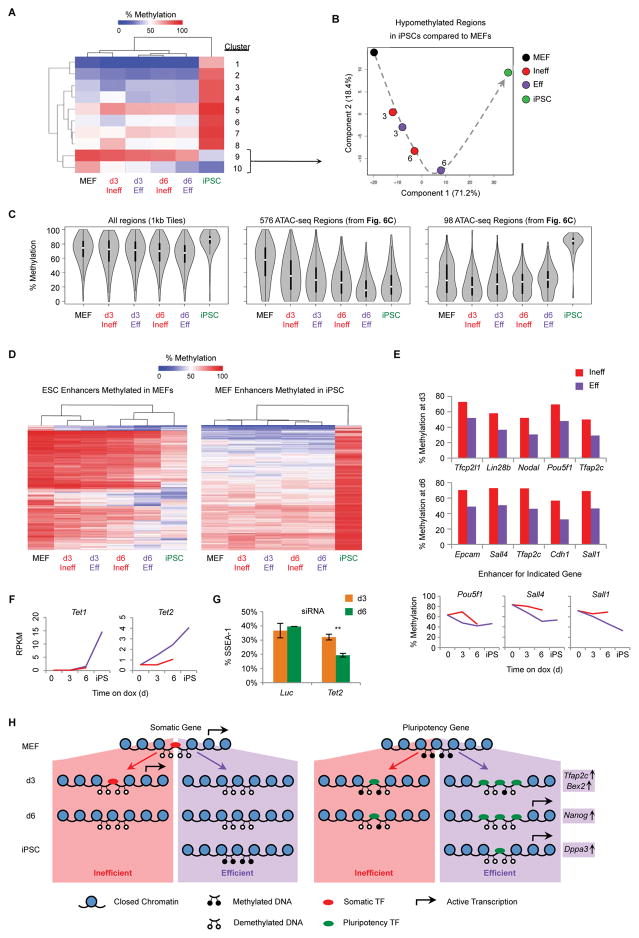
Figure 7. DNA Methylation and Demethylation are Uncoupled During Reprogramming.
(A) WGBS was performed on the indicated populations. Shown is a heatmap of 1 kb tiling regions that show a change of at least 30% between MEF and iPSCs as measured by WGBS. Regions were grouped into ten clusters based on hierarchical clustering.
(B) PCA of WGBS data using 1 kb DNA tiles that are hypomethylated in iPSCs relative to MEFs (Clusters 9 and 10, Figure 7A). Numbers indicate the reprogramming time point of intermediates. The dotted arrow indicates the proposed trajectory of DNA methylation changes during reprogramming.
(C) Violin plots of global DNA methylation for the indicated regions. Plots show the distribution of methylation values for each sample. White circle: median methylation value. Black box: interquartile range. Whisker extend to the most extreme data point which is no more than 1.5 times the interquartile range from the box.
(D) Heatmaps showing DNA methylation levels at ESC enhancers (Shen et al., 2012) that are hypermethylated in MEFs compared to iPSCs (left) and MEF enhancers that are hypomethylated in MEFs compared to iPSCs (right).
(E) DNA methylation levels for key ESC enhancers differentially methylated at d3 (top) or d6 (middle) of reprogramming (Table S5).
(F) Gene expression levels, determine by RNA-seq, for Tet1 and Tet2. Results are shown as the mean of two replicates (Red line: Ineff; Purple line: Eff).
(G) ¾ MEFs were transfected with siRNA targeting Tet2 or a Luc control at d0 and d3 of reprogramming. At d3 (orange) or d6 (green) the percentage of SSEA-1+ cells was determined by flow cytometry. Results are shown as the mean of 3 experiments ±1 S.D. Statistical differences were determined by the unpaired Student’s t-test, ** p<0.005.
(H) Model of chromatin changes observed in Eff and Ineff intermediates during reprogramming.

