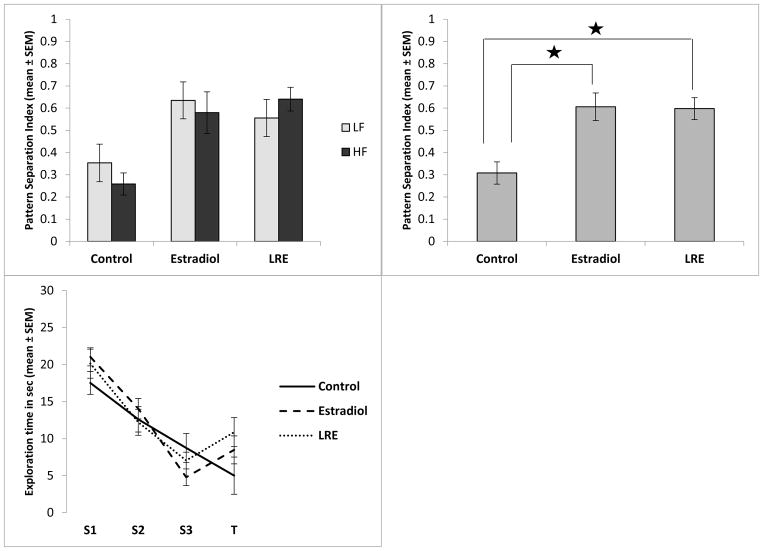
Figure 3.
A). (Top left panel) In the LRE MCOL study, there was a main effect of exposure on the pattern separation index, but no effect of dietary fat and no interaction between dietary fat and exposure. Low fat and high fat groups are represented with light or dark bars respectively. B). (Top right panel) In panel B low fat and high fat groups are combined showing the main effect of exposure. Both the estradiol group and the LRE group had significantly higher pattern separation index scores than the control group (Control vs Estradiol, p=0.001, Control vs LRE, p=0.001). C). (Bottom left panel) Raw exploration time of both objects in each trial, with low fat and high fat groups combined.

