
Figure 1. (A) Women have increased Salt Sensitivity of Blood Pressure (BP) when compared to men.
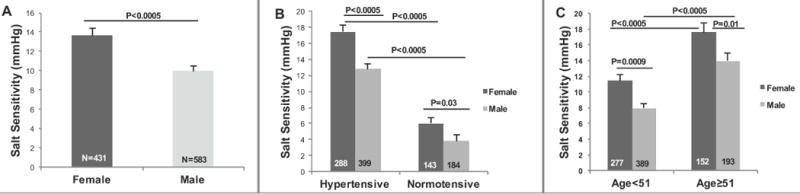
Salt Sensitivity = Baseline Systolic BP (SBP) on a liberal salt diet – Baseline SBP on a restricted salt diet. (B) Salt Sensitivity of BP is higher in women than men in both hypertensive and normotensive state. (C) Salt Sensitivity of BP increased with age in both males and females, but the females still had significantly greater salt sensitive BP than males regardless of age. The P values are from Multiple Linear Regression models that were adjusted for age, sex, body mass index, site and disease state. Values represent the means ± SEM. A propensity score was also calculated for the total population (Coefficient= 3.12; p= 0.001; 95% Confidence Intervals (CI)= 1.21, 5.02).