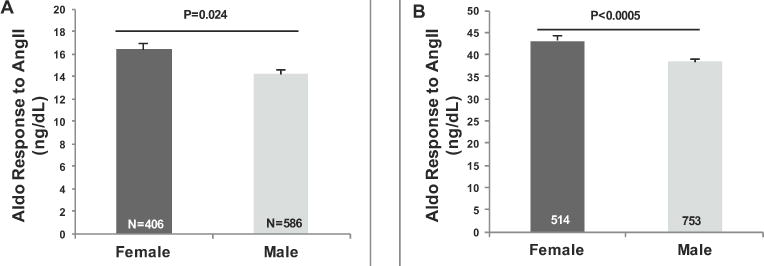
Figure 2. Aldosterone (Aldo) responses to angiotensin II (AngII) are greater in women than men on either a Liberal or Restricted Salt Diet.

Aldo responses were determined on a Liberal Salt (A) or restricted salt (B) diet. The P values are from Multiple Linear Regression models that were adjusted for age, sex, body mass index, site, disease state, PRA, plasma K+, urine K+ and plasma cortisol. Values represent the means ± SEM. Propensity scores were also calculated for the total population: A) liberal salt (Coefficient= 3.24; p< 0.000; 95% CI= 1.83, 4.66); B) restricted salt (Coefficient= 7.10; p< 0.000; 95% CI= 4.28, 9.91).
