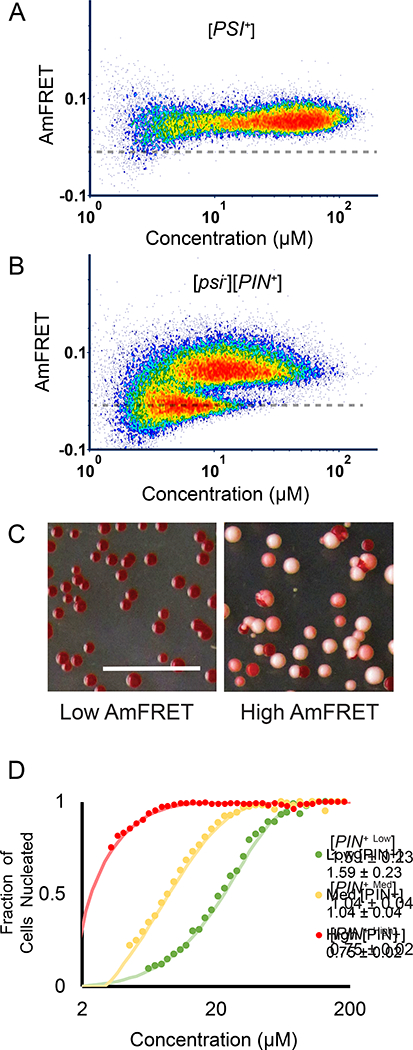
Figure 2. Amyloid structure determines the persistence of the nucleation barrier with respect to concentration.

(A) DAmFRET plots of Sup35 PrD in cells with amyloids of endogenous Rnq1 ([PIN+]) and Sup35 ([PSI+]).
(B) Same as (A), but without Sup35 amyloids ([PSI−])
(C) Representative images of colonies of cells from Sup35 colony color assay. Left and right panels show colonies grown from cells sorted from the low or high AmFRET populations, respectively, as shown in figure 2B.
(D) Weibull fits of DAmFRET of Sup35 PrD in cells with different amyloid isoforms of endogenous Rnq1: [PIN+high], [PIN+medium], and [PIN+low]. The inset shows δ ± error. See also Fig. S2.
