
Figure 6. Nucleation barriers enable proteotoxic assemblies to accumulate.
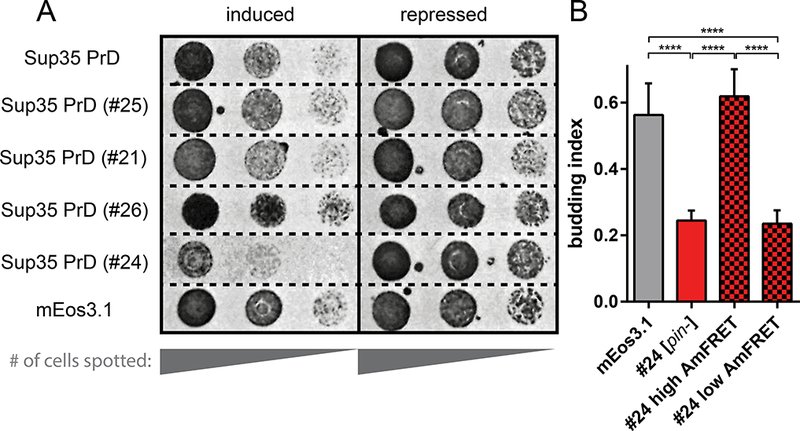
(A) [pin-] cells harboring plasmids encoding the indicated proteins spotted as five-fold serial dilutions onto media with either galactose (inducing) or glucose (repressing).
(B) Budding indices of cells expressing Sup35 PrD #24 or unfused mEos3.1 to the same intensity (5000 – 7000 AU). Solid red and checkered bars denote [pin-] and [PIN+] cells, respectively. The latter is divided into “high” (amyloid) and “low” (non-amyloid) AmFRET subpopulations. Shown are means of five experiments; error bars represent 95 % CI; ****, p<0.0001 (ANOVA).