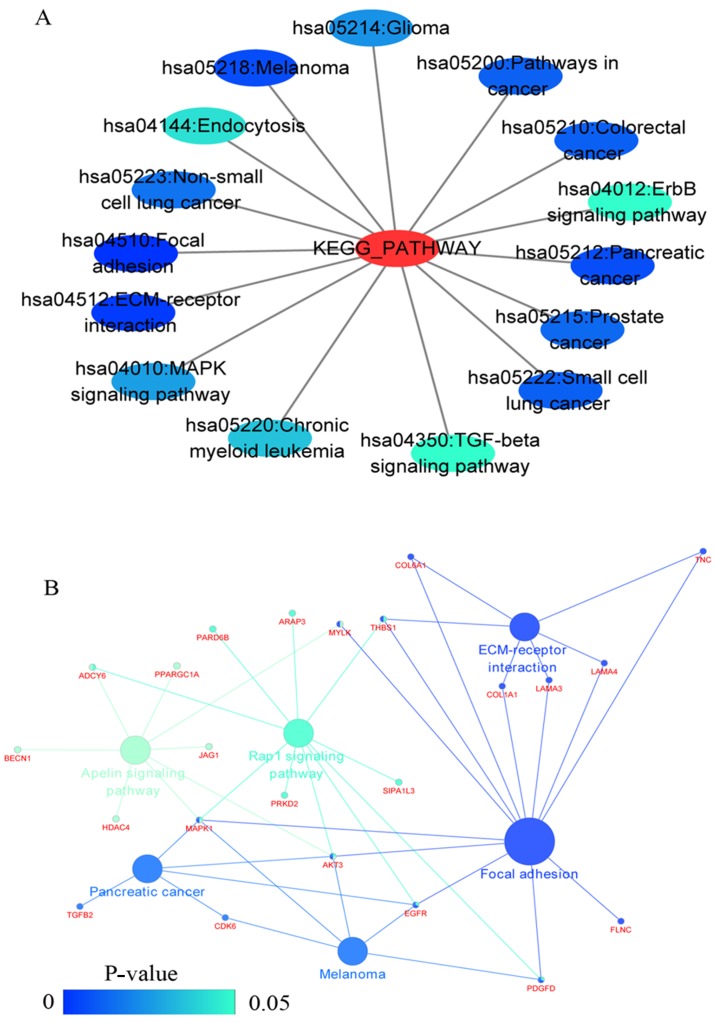
Figure 10.
(A) Network mappings of KEGG pathway anlaysis of HOXA3 co-expression genes in LUAD. (B) The significantly signalling pathways (P<0.05) enriched HOXA3 co-expression genes in LUAD constructed by the ClueGO plugin. The color of circles represents the P-value of the signalling pathways. HOXA3, homeobox A3; KEGG, Kyoto Encyclopedia of Genes and Genomes; LUAD, lung adenocarcinoma.

