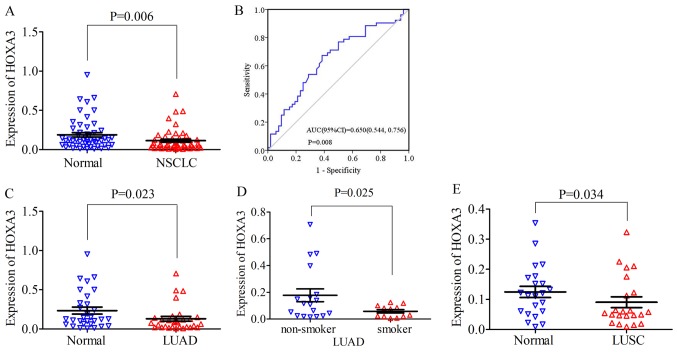
Figure 2.
(A) Scatter diagram of HOXA3 expression between NSCLC tissue and normal lung tissue detected by RT-qPCR. (B) ROC curve of HOXA3 expression in NSCLC tissue. (C and D) Scatter plots of HOXA3 level in LUAD detected by RT-qPCR. (C) Differences between cancer and non-cancer. (D) Differences between smoker and non-smoker in LUAD. (E) HOXA3 expression between LUSC tissue and normal lung tissue detected by RT-qPCR. HOXA3, homeobox A3; NSCLC, non-small cell lung cancer; LUAD, lung adenocarcinoma; LUSC, lung squamous cell carcinoma.

