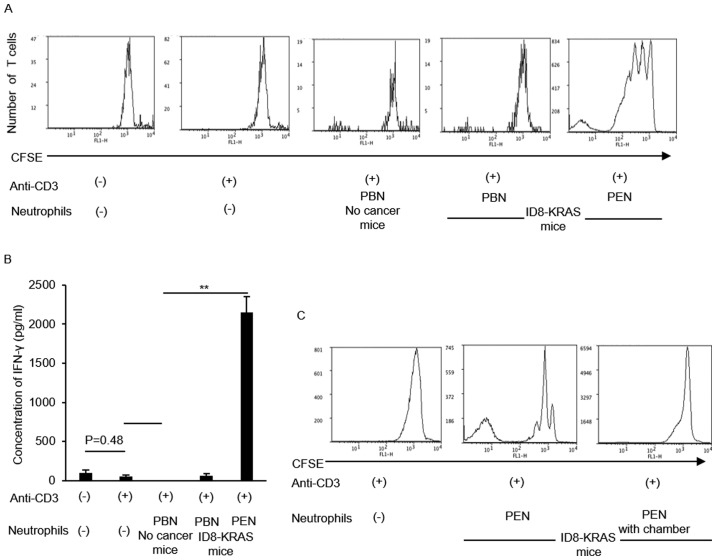
Figure 5.
In vitro effects of neutrophils on CD8+ T cell activation. CFSE-labeled naïve CD8+ T cells were isolated from the spleen of no cancer mice (n=8). Naïve CD8+ T cells (2.0×10⁶ cells/ml) were cocultured with neutrophils (2.0×10⁶ cells/ml) from each group under stimulation of plate-bound anti-CD3 antibody for 3 days. Neutrophils were obtained from PBNs of no cancer mice or PBNs and PENs of ID8-KRAS mice (n=8). PBN and PEN indicate peripheral blood neutrophil and peritoneal neutrophils, respectively. (A) The CFSE signal was analyzed by flow cytometry. The data provided are representative results of 3 independent experiments. (B) The concentration of IFN-γ in the supernatant of each culture medium was analyzed by specific ELISA. The data provided are representative results of 3 independent experiments. Error bars represent the means ± SEM. Statistical analysis was performed using the Student's t-test. The P-value was adjusted using the Holm's method (*P<0.05, **P<0.01). (C) To assess the effects of cell-to-cell interactions between T cells and neutrophils, PENs of ID8-KRAS mice were added to the upper compartments of the chambers at a concentration of 2.0×10⁶ cells/ml. Naïve CD8+ T cells were added to the bottom chamber at a concentration of 2.0×10⁶ cells/ml and cocultured for 3 days in CD3-coated plates. The CFSE signal was analyzed by flow cytometry. The data provided are representative results of 3 independent experiments.

