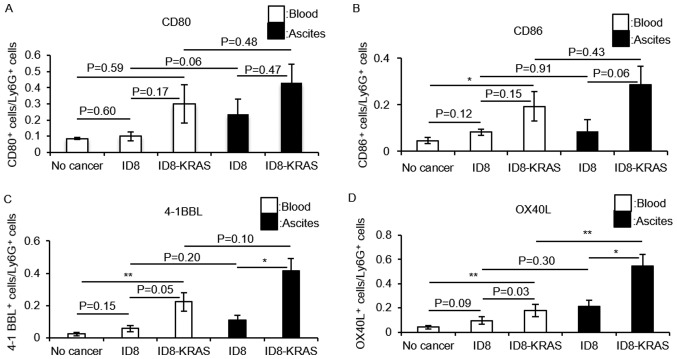
Figure 6.
Expression of T cell costimulatory molecules on neutrophils. Murine ID8 cells (2×10⁶) and ID8-KRAS cells (2×10⁶) were injected into mice, and neutrophils were obtained from ascites or blood when the body weight exceeded 23 g. Neutrophils from no cancer mice were used as a control. (A-D) The expression of costimulatory molecules on the gated Ly6g+ neutrophils from ascites or blood was analyzed by flow cytometry. The number of mice used in each experiment was as follows: (A) CD80: no cancer, n=8; ID8, n=5; ID8-KRAS, n=7; (B) CD86: no cancer, n=6; ID8, n=6; ID8-KRAS, n=5; (C) 4-1BBL: no cancer, n=11; ID8, n=5; ID8-KRAS, n=7; (D) OX40L: no cancer, n=10; ID8, n=5; ID8-KRAS, n=8. Error bars represent the means ± SEM. Statistical analysis was performed using the Student's t-test. The P-value was adjusted using the Holm's method (*P<0.05, **P<0.01). PBNs and PENs indicate peripheral blood neutrophils and peritoneal neutrophils, respectively.

