. 2018 Jul 25;7:e39383. doi: 10.7554/eLife.39383

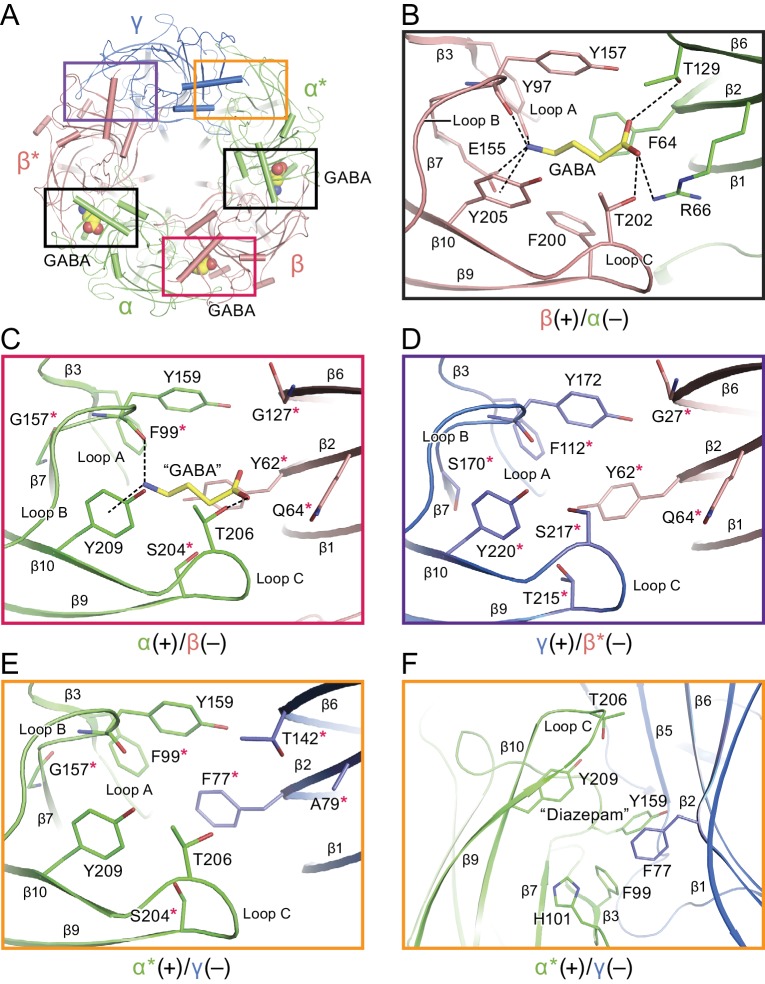
Figure 3. Neurotransmitter binding sites.

(a) Top down view of the receptor looking from the extracellular side. The α and α* subunits are colored in salmon, β and β* are colored in lime, and γ is colored in marine. GABA molecules are shown in sphere representation. (b) View of the binding site between the β*(+)/α(-) subunits viewed parallel to the membrane. Dashed lines indicate hydrogen bonds, cation-π interactions and salt bridges. The β*(+) and α(-) subunits are colored in salmon and lime, respectively. The residues in the β*(+) and α(-) subunits and GABA are depicted in salmon, lime and yellow sticks, respectively. (c) View of the binding site between the α(+)/β(-) subunits viewed parallel to the membrane. Subunits and residues are depicted in the same color code as in (b). The residues differing from the corresponding residues in the β*(+)/α(-) binding site are indicated with red stars. (d) View of the binding site between the γ (+)/β*(-) subunits looking parallel to the membrane. Residues in the γ(+) and β*(-) binding site are shown in marine and salmon sticks, respectively. The residues differing from the corresponding residues in the β*(+)/α(-) binding site are indicated with red stars. (e) View of the binding site between the α*(+)/γ(-) binding site viewed parallel to the membrane. Residues in the α*(+) and γ(-) binding site are shown in lime and marine sticks, respectively. The residues differing from the corresponding residues in β*(+)/α(-) are indicated with red stars. (f) Similar view of the diazepam binding site as in panel (e).

Figure 3.

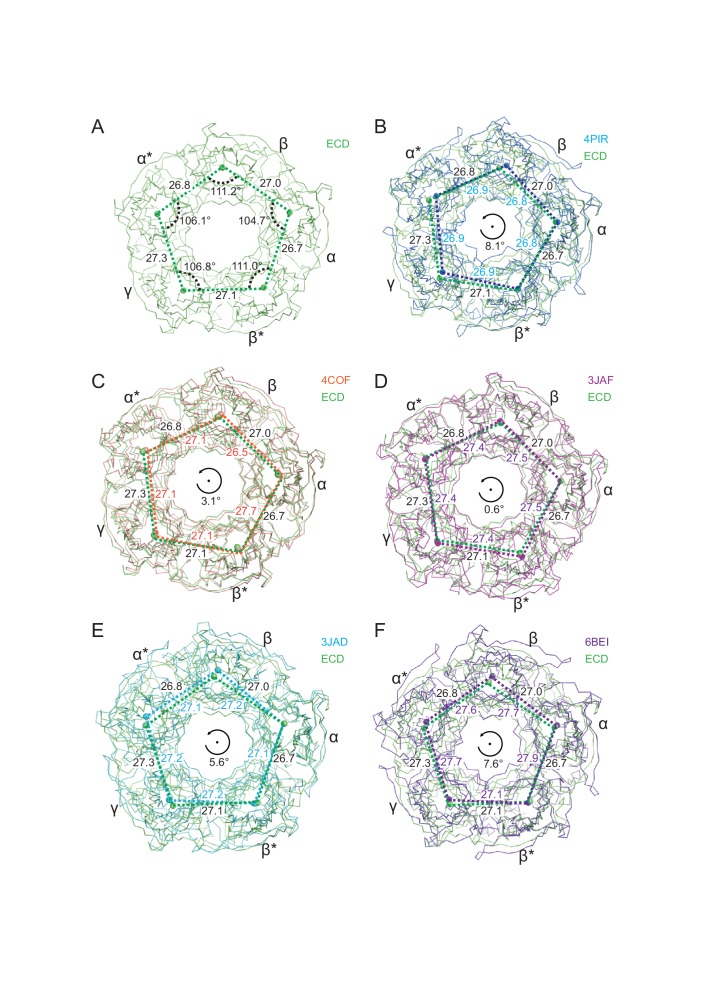
Figure 3—figure supplement 1. Superposition of the tri-heteromeric GABAA receptor ECD structure with the 5-HT3A receptor structure (PDB code: 4PIR and 6BE1), the homo GABAA β3 structure (PDB code: 4COF), the strychnine bound glycine receptor structure (PDB code: 3JAD), and the ivermectin-glycine bound glycine receptor structure (PDB code: 3JAF).

Figure 3—figure supplement 1.

The Cα traces from chain A are used to do the alignment. (a) The distances between the nearby centers of mass, together with the angles of the pentagon of centers of mass, are shown. (b) The ECD structure is in lime and 4PIR is in marine. Lime and marine balls indicate the centers of mass of one subunit for the ECD structure and 4PIR, respectively. The distances between the two nearby centers of mass are labeled. The distances related to the ECD are labeled outside of the pentagon and the distances labeled inside the pentagon are for 4PIR. The angle indicates the approximate rotation of the pentagon formed by the five centers of mass between the ECD and 4PIR. (c), (d), (e) and (f) similar to (a), the distances between the nearby two centers of mass are shown overlapping with the ECD structure.
Figure 3—figure supplement 2. Densities surrounding the GABA binding pocket.
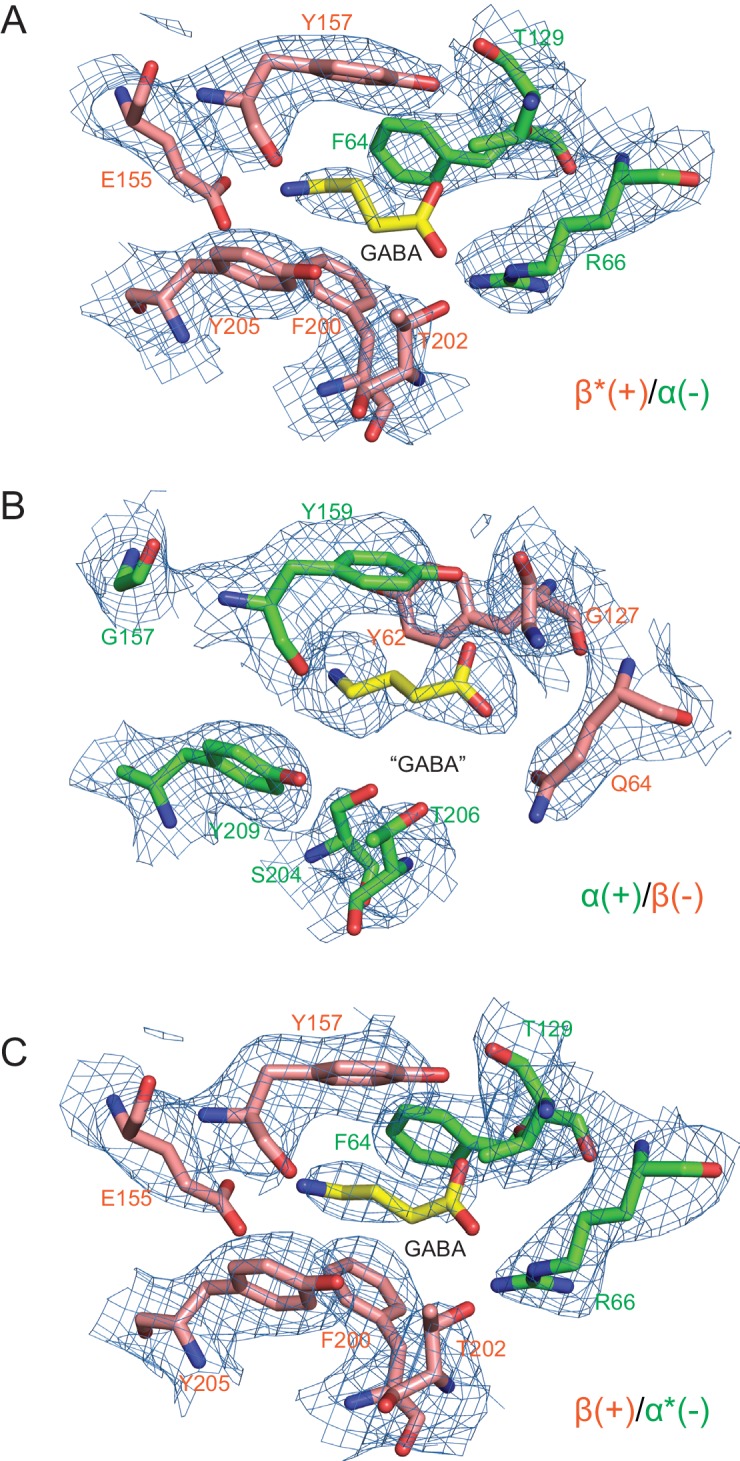
Figure 3—figure supplement 2.

Three non-protein densities were found between the interfaces of subunits, (a) for the β*(+)/α(-) interface, (b) for the α(+)/β(-) interface and (c) for the β(+)/α*(-). GABA molecules were placed in these densities colored with yellow bonds, blue nitrogen and red oxygen. To fit the GABA molecules to their respective density features we utilized the shapes of the density features and the surrounding chemical environments. The resulting structural models resulted in a good fit of GABA to the density and chemically reasonable ligand-protein interactions.
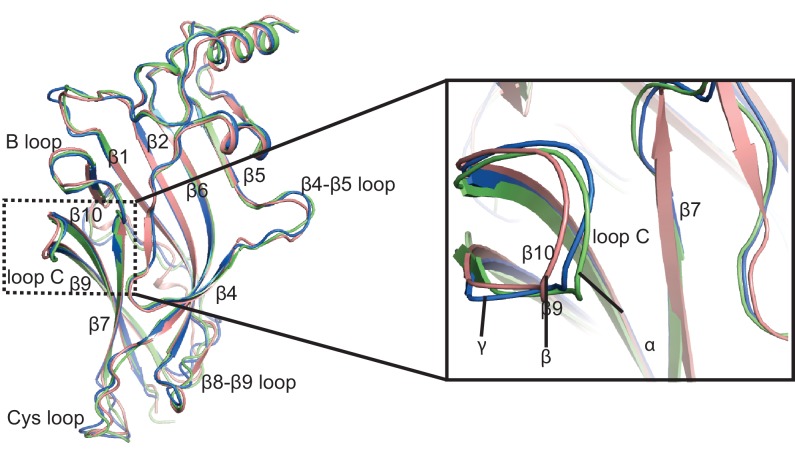
Figure 3—figure supplement 3. Superposition of the ECD between α, β* and γ subunits.

Figure 3—figure supplement 3.

α, β and γ subunits are colored in salmon, lime and marine, respectively. The ligand binding site is indicated with a black dash frame.
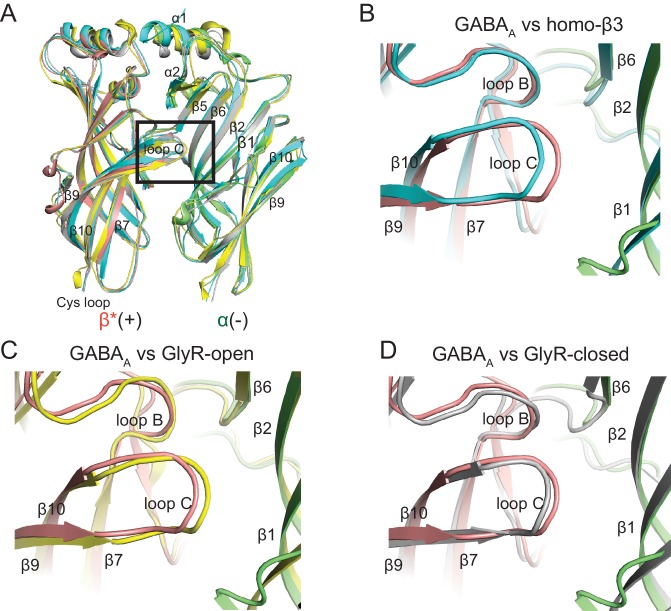
Figure 3—figure supplement 4. Superposition of the ECD of β*/ α subunits with the structure for human β3 GABAA (PDB code: 4COF), GlyR-open (PDB code: 3JAE) and GlyR-closed (PDB code: 3JAD) to illustrate the configuration of loop C in each structure.

Figure 3—figure supplement 4.

(a) Overall comparison of ECD of β*/ α subunits with the human β3 GABAA, GlyR-open and GlyR-closed. β*(+) and α(-) are colored in salmon and lime. Human-β3, GlyR-open and GlyR-closed are colored in cyan, yellow and gray, respectively. Loop C was highlighted with a black frame. The enlarged view of loop C is shown in (b), (c) and (d).