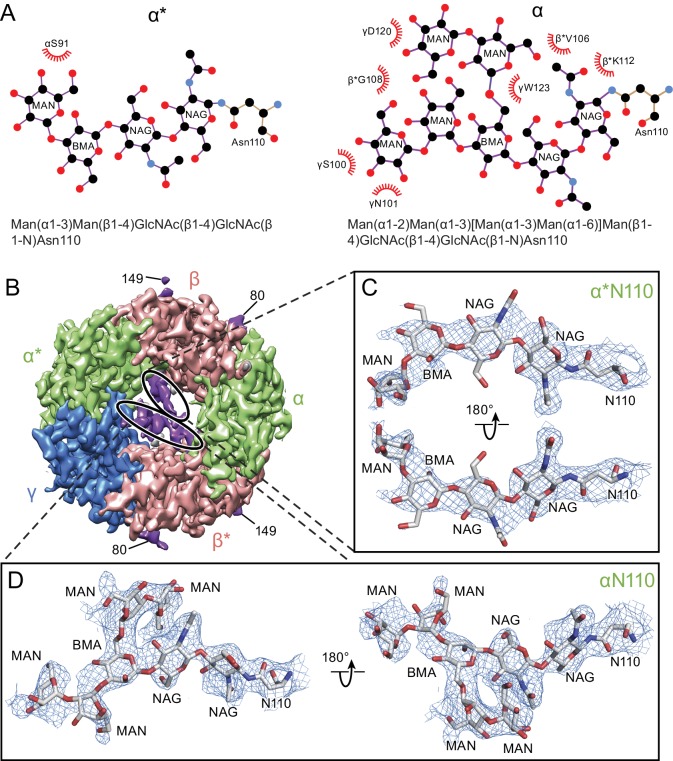
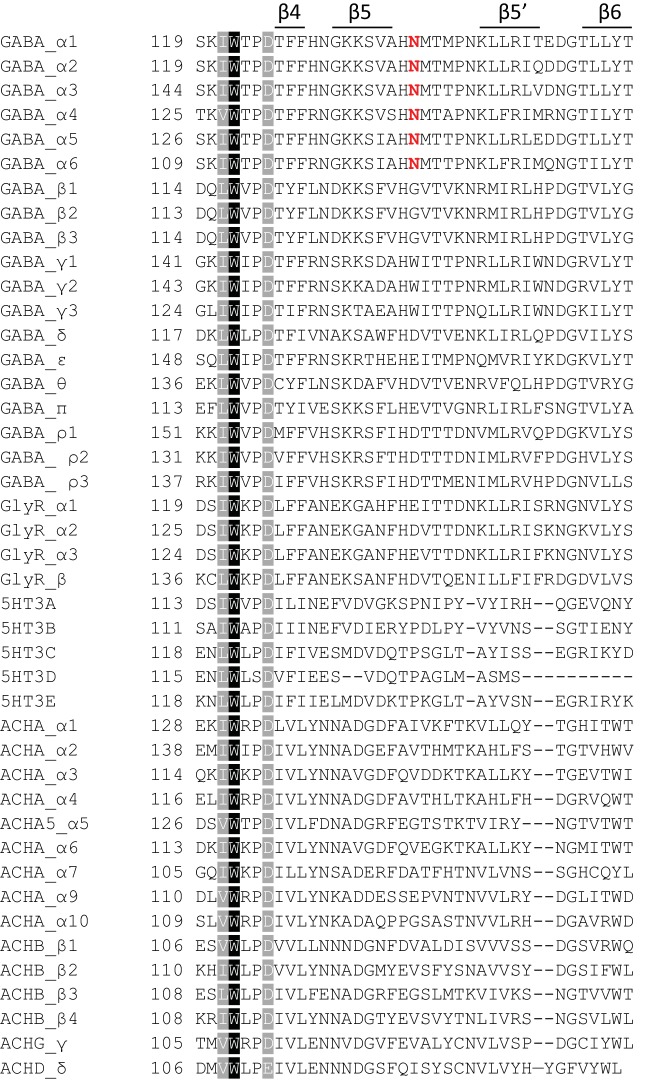
Figure 4. Glycosylation sites in the extracellular vestibule.
(a) Schematic of the sugar chain chemical structure for the Asn110 modification. The amino acids interacting with the sugar chains are also shown. The names of the carbohydrates are given at the bottom of the panel (Gamian, 1992). (b) Top down view of ECD map. The α, β and γ subunits are colored by light green, salmon and blue, respectively. The glycosylation densities are colored by purple. The related Asn residue numbers are labeled. (c) Two views of the density of the glycosylation from the α* subunit, isolated and fitted with four sugar molecules. Asn110 and the name of sugars are labeled. (d) Similar panel to (c), showing the density of the glycosylation on the α subunit fit with a carbohydrate chain containing seven sugar residues.


