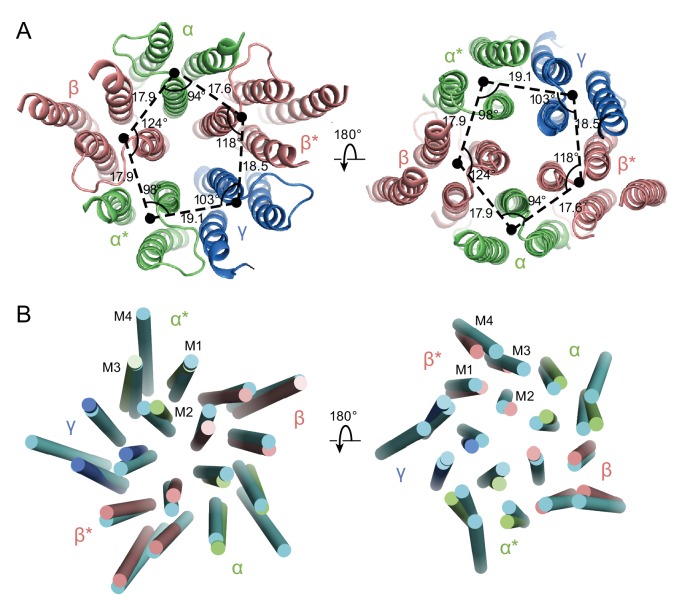
Figure 6. Asymmetry in the TMD.
(a) View of the TMD from the extracellular (left panel) side or from the intracellular side (right panel) of the membrane. The α and α* subunits are colored in salmon, β and β* are colored in lime, and γ is colored in marine. Center of mass of M1, M2 and M3 helices for each subunit, shown as a solid black circle, was generated by Pymol. Distances are in Å. (b) Superposition of the TMD in the GABAA receptor with human β3 (PDB code: 4COF). The TMD of the human β3 is colored in cyan.

