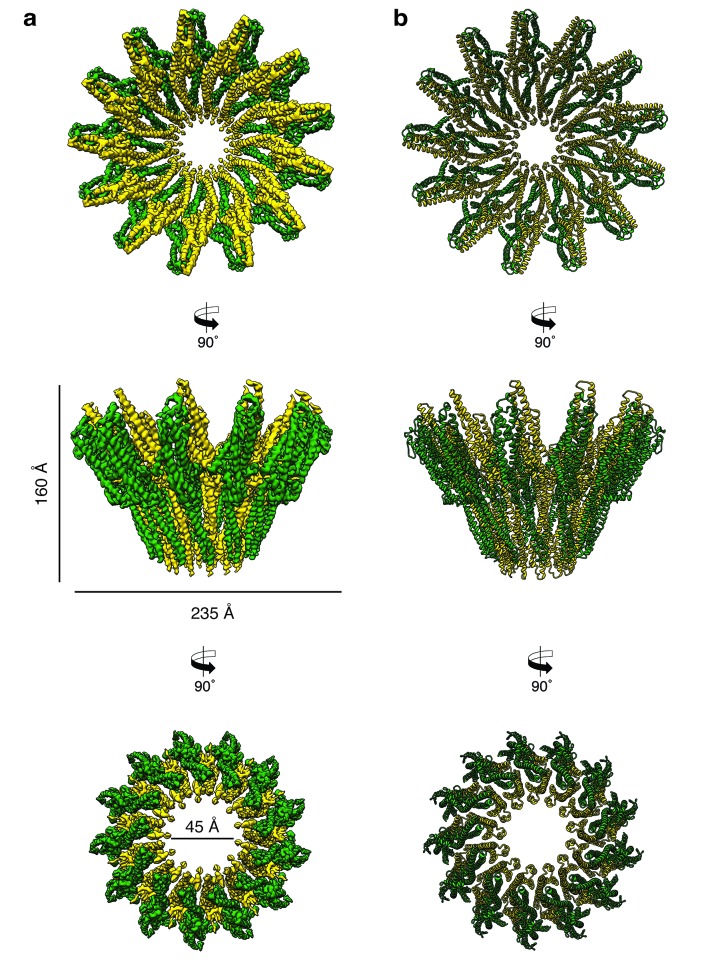
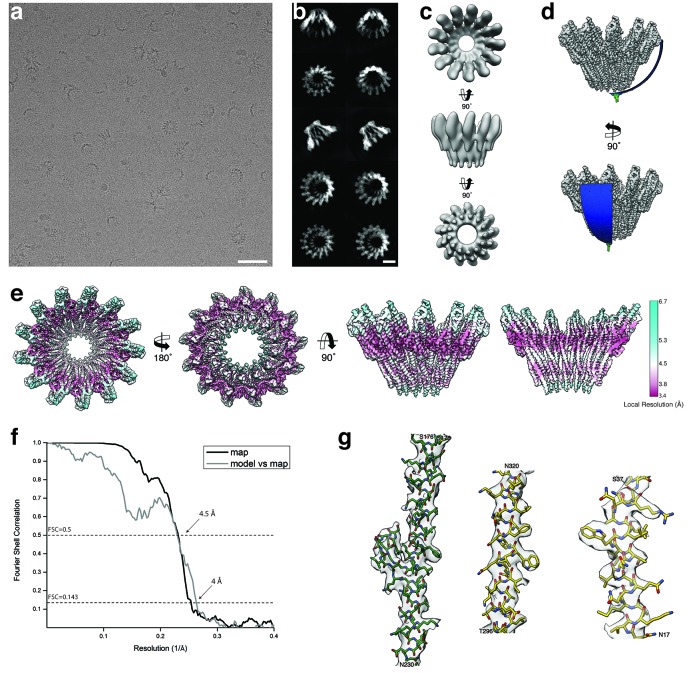
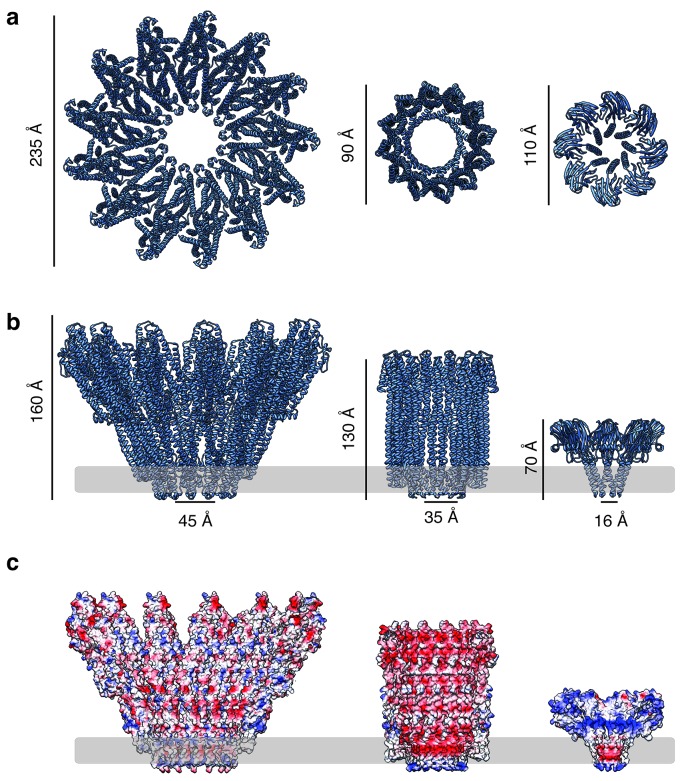
Figure 3. Cryo-EM structure of the tridecameric XaxAB pore complex.
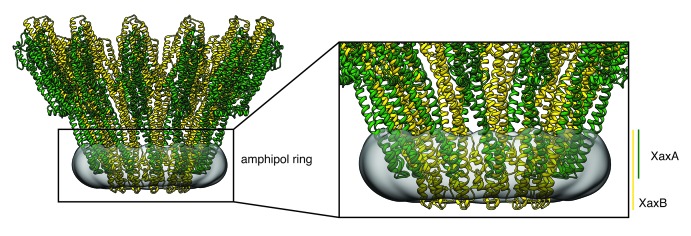
(a) Cryo-EM density map of tridecameric XaxAB pores shown as top, side and bottom view. XaxA and XaxB are colored in green and yellow, respectively. (b) Ribbon representation of the atomic model of XaxAB. Colors shown as in (a).

