Fig. 2.
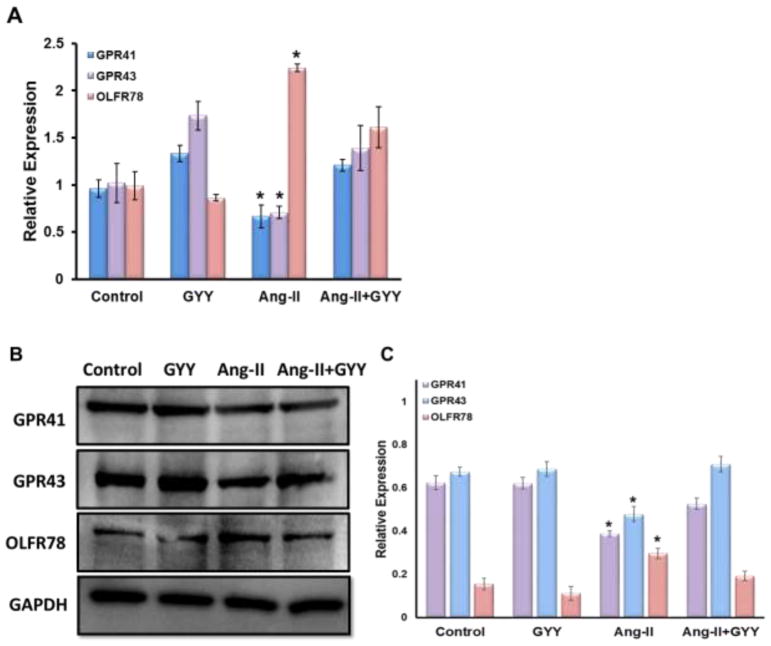
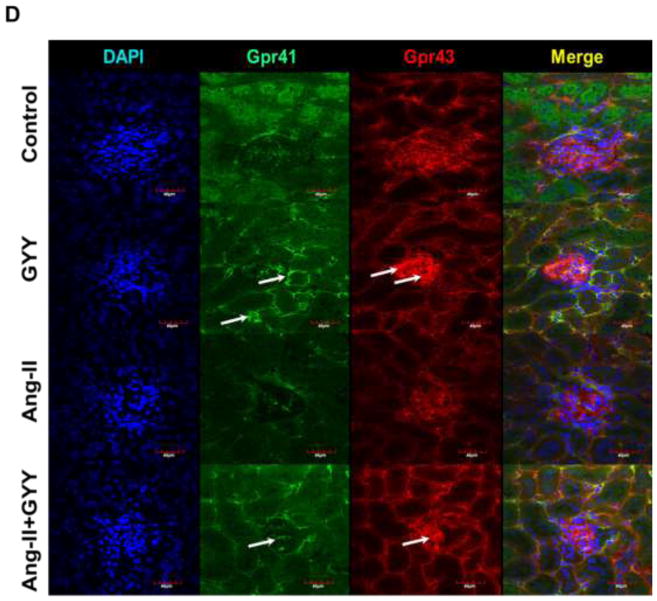
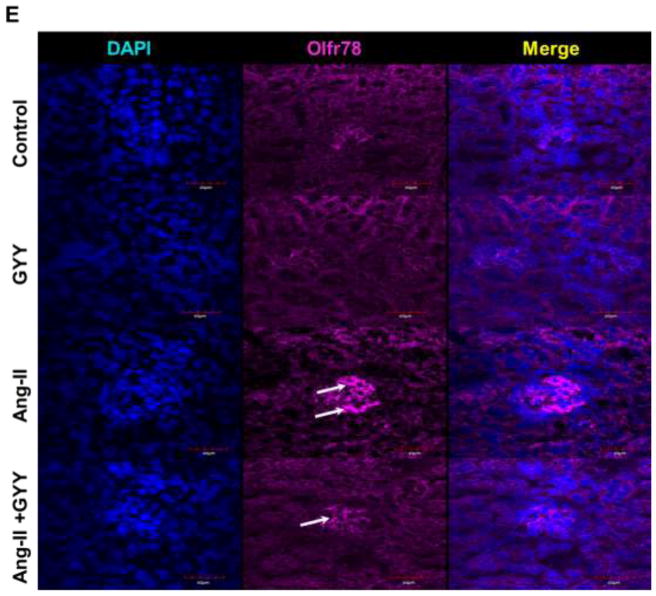
Short chain fatty acid receptors are altered in the hypertensive kidney. (A) qPCR analysis of Olfr78, Gpr41, and Gpr43 expression in kidney of Ang-II and GYY treated mice. (B) Western blot analysis and (C) bar graph of protein levels of SCFA receptors. Band intensities were quantified using ImageJ. Bar graphs are the mean intensities ± SD. n=5/group. *p < 0.05 Control vs. Ang-II; (D–E) Immunostaining for Gpr41 and Gpr 43 showed increased expression in glomeruli and proximal tubules (white arrows). (F) Immunostaining for Olfr78 showed increased expression and localization in the glomerulus. Magnification, ×60. Scale bars, 40 μm.


