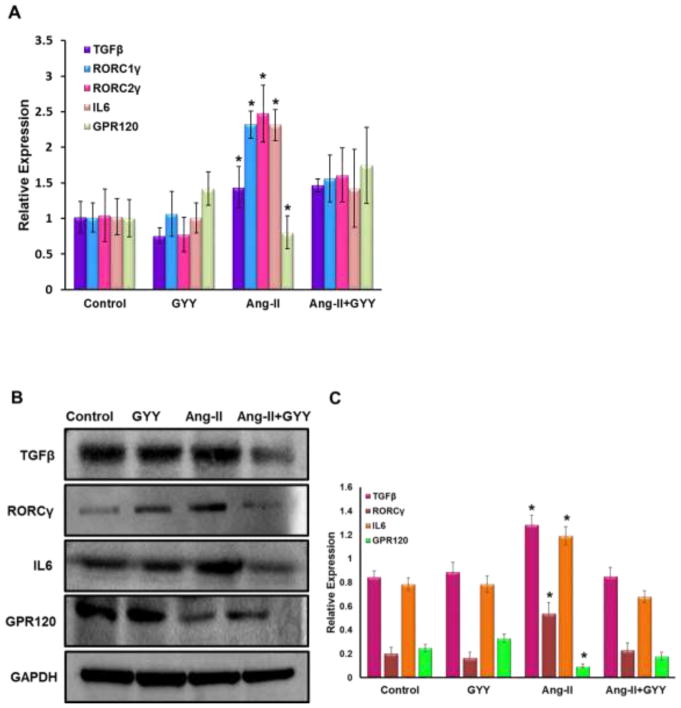
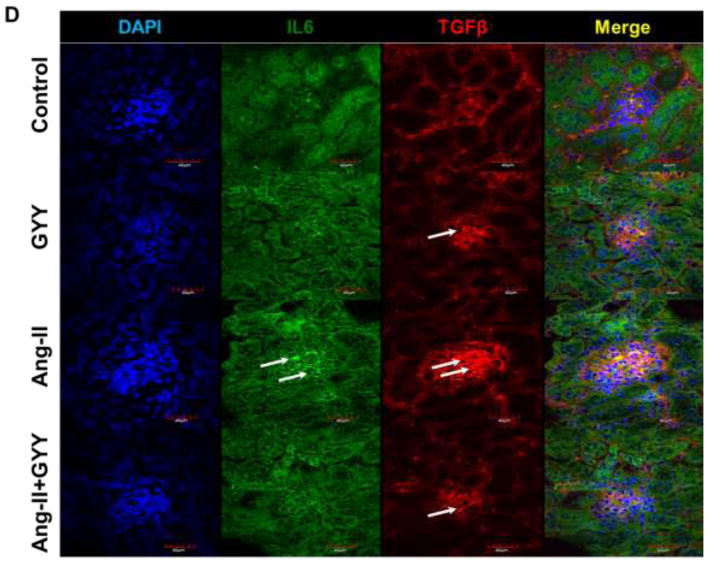
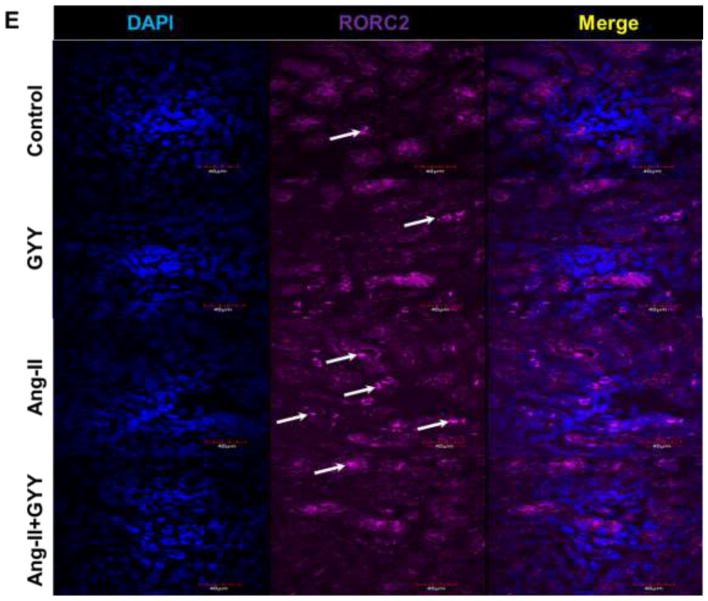
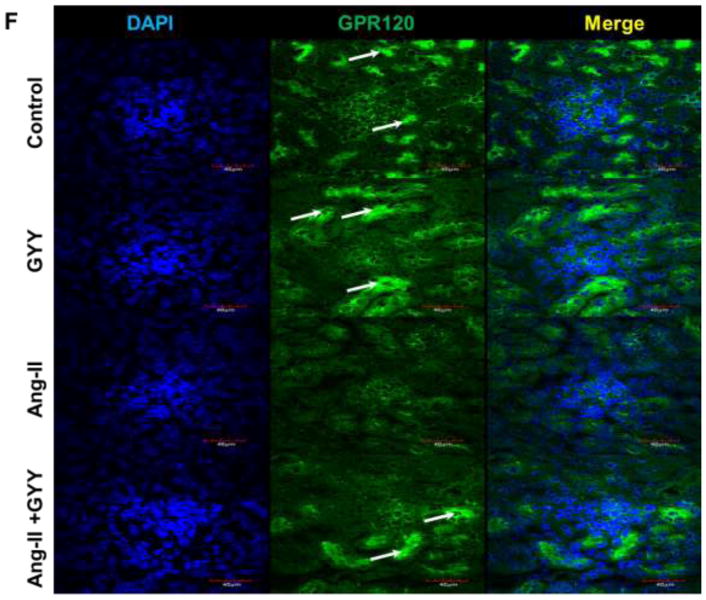
Fig. 3.
Ang-II induced inflammatory response in kidney. (A) Inflammatory markers were assessed by qPCR, including Tgfβ, Il6, Rorc1γ, Rorc2γ, and reported anti-inflammatory fatty acid receptor Gpr120. (B) Western blot analysis and (C) bar graph of protein levels inflammatory markers and long chain fatty acid receptor Gpr120. Bar graphs are the mean intensities ± SD. n=5/group. *p < 0.05 Control vs. Ang-II; (D) Immunostaining for Tgfβ and Il6 showed increased expression and localization in glomeruli (white arrows). (E) Immunostaining for Rorcγ showed increased expression and localization in the tubules and vessels around the glomerulus while (F) Gpr120 was less in hypertensive kidney (white arrows). GYY increased expression of GPR 120. Magnification, ×60. Scale bars, 40 μm.


