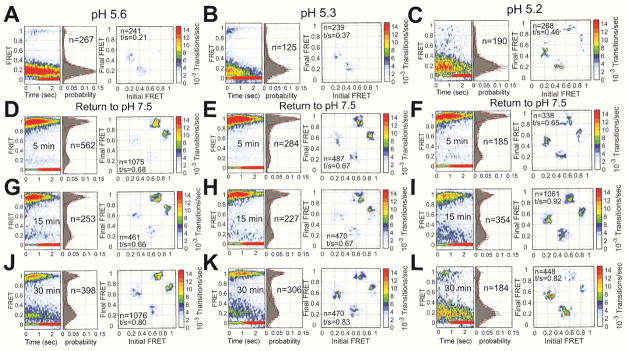
Figure 4. Restoration of the pre-fusion conformation after return to neutral pH.
FRET contour plot, FRET histogram and TDP acquired immediately after exposure of HA to (A) pH 5.6 (repeated from Figure 2), (B) pH 5.3, or (C) pH 5.2. The same data were acquired after returning to pH 7.5 following (D–F) 5 min, (G–I) 15 min, or (J–L) 30 min. Data are displayed as in Figure 2. See also Table S1.

