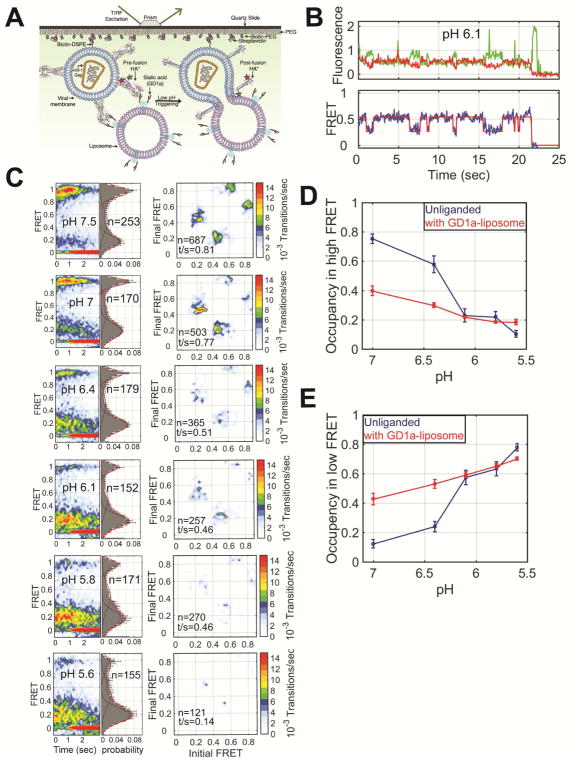
Figure 5. Interaction with a sialic acid-containing target membrane regulates HA conformational dynamics.
(A) Schematic of the smFRET-imaging assay in the presence of liposomes containing GD1a, which contains sialic acid (STAR Methods). (B) Representative fluorescence and FRET traces at pH 6.1 displayed as in Figure 2. (C) FRET contour plots (left), FRET histograms (middle) and TDPs (right) displayed as in Figure 2. Quantification of the occupancies in the (D) high-FRET pre-fusion and (E) low-FRET conformations in the absence (blue) and presence (red) of liposomes, which was determined through HMM analysis. See also Table S1.

