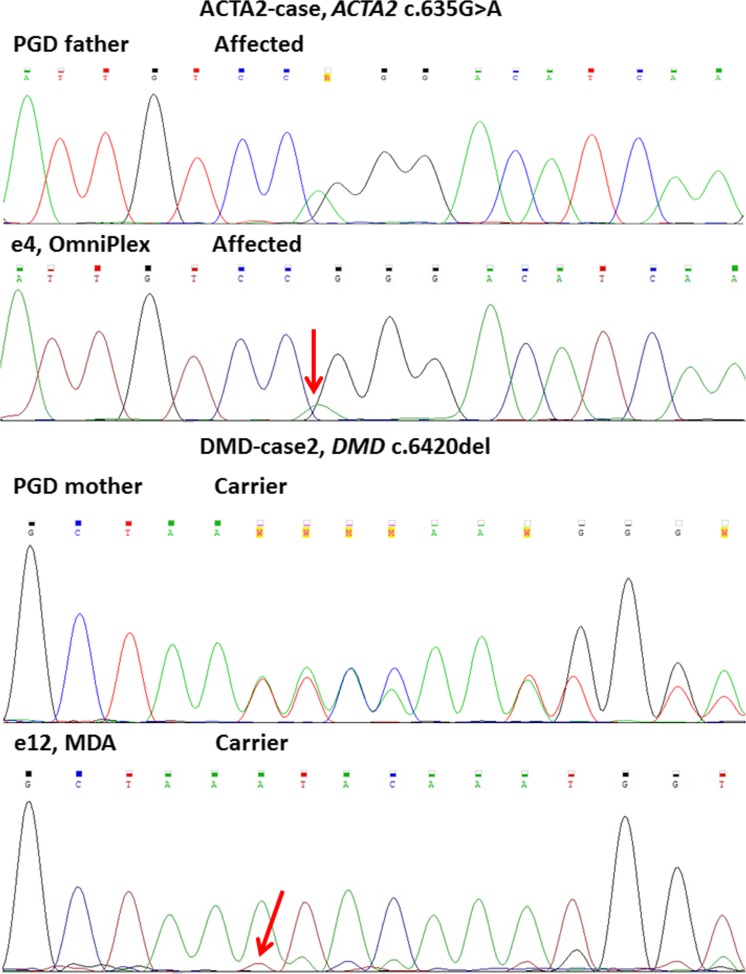
Fig. 2.
Sanger sequencing profiles of different WGA technologies. ACTA2-case and DMD-case 2 are shown. PGD father (first upper panel) and PGD mother (third panel) represent locus controls performed on gDNA. Haplotype analysis of both given embryos corresponds to heterozygous genotype (confirmed by STR haplotyping). Red arrows mark partial loss (partial allelic dropout, ADO) of disease-causing allele in analysed embryos, which are only detectable as weak background profiles similar to noise

