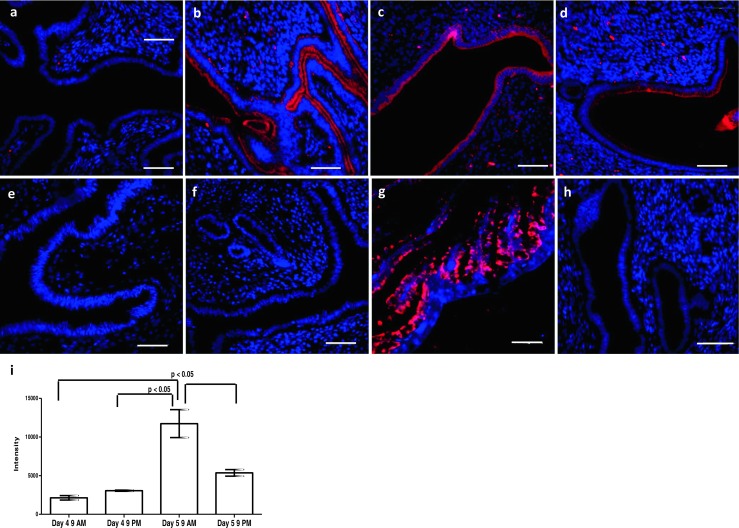
Fig. 1.

Expression of OVGP1 in mouse endometrium at time of embryo implantation. Paraffin sections were probed with OVGP1 antibody and detected with Alexa Fluor 568. a Day 4 morning. b Day 4 evening. c Day 5 morning. d Day 5 evening. e Estrus stage. f Diestrus stage. g Oviduct. h Negative control (without primary antibody). Red staining is for OVGP1, and blue is for the nuclei. Scale bar is 50 μm. i Intensity of OVGP1 staining during the course of embryo implantation. Y-axis is the intensity values for OVGP1 staining. Data is mean ± SD for the three biological replicates at each point. * indicates significant difference as compared to control (p < 0.05)
