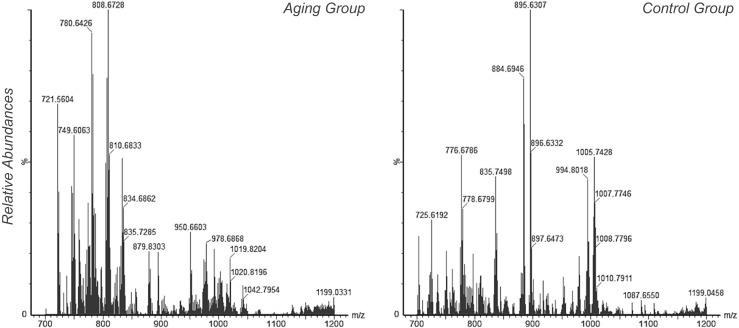
Fig. 1.

Representative mass spectra of follicular fluid analysis by MALDI-TOF-MS for each group included in the present study. The x axis indicates m/z, while y axis indicates relative abundance of ions. Mass spectrum selection for each group considered the spectrum of a sample that was visually similar to the spectrum of other samples
