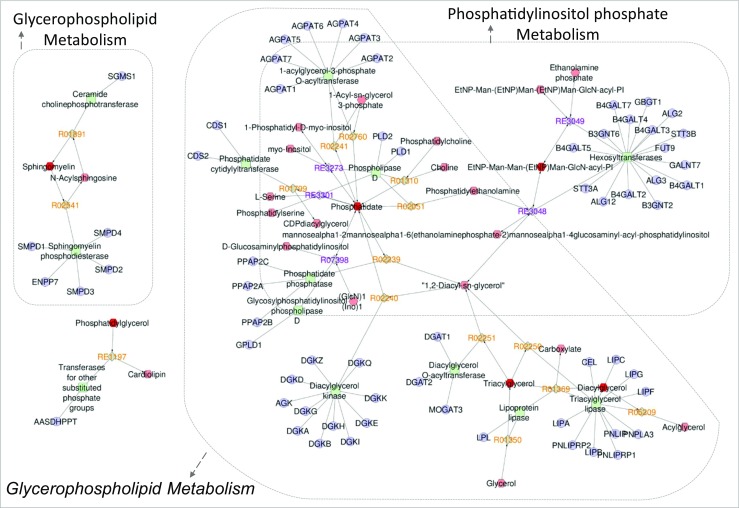
Fig. 3.

Network interaction analysis considering the lipid attributions of the aging group. The Metscape application indicated three enhanced pathways: glycosphingolipid metabolism; phosphatidylinositol phosphate metabolism, and glycerophospholipid metabolism. The metabolites of increased abundance in the aging group are represented by hexagons. Different relations were observed with enzymes (squares), genes (circles), and associated reactions (diamonds)
