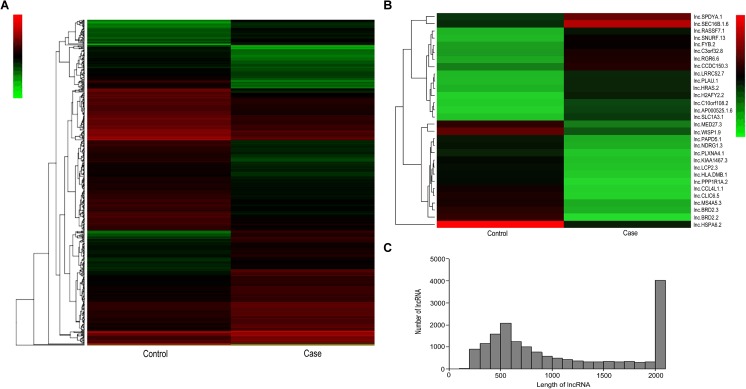
Fig. 2.
Heat map and hierarchical clustering showing expression values of all lncRNAs and the most up- and downregulated lncRNAs. Each column represents a sample, and each row represents a lncRNA. Red strip represents high relative expression, and green strip represents low relative expression. Case represents OHSS high-risk group, and control represents OHSS low-risk group. a Hierarchical cluster analysis of all lncRNAs using methods from Gene Spring software. b Hierarchical cluster analysis of the most up- and downregulated lncRNAs. c Frequency distribution of lncRNAs length. X axis: the range of lncRNAs length in granulosa cells between OHSS high-risk and low-risk patients. Y-axis: the frequency of lncRNAs with specific length

