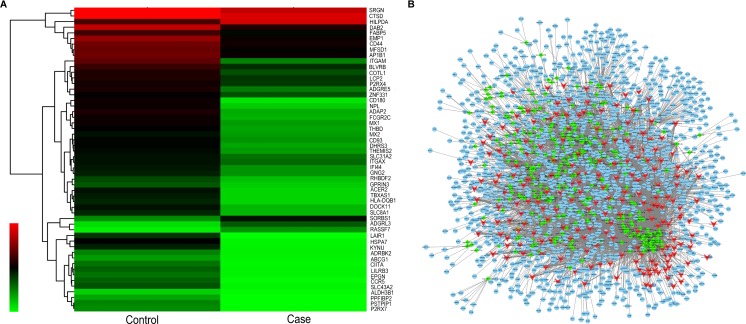
Fig. 4.
The lncRNA/miRNA/mRNA network analysis. a Cluster analysis of the expression alternation of target genes and the target genes are displayed. b The lncRNA/miRNA/mRNA interaction network consists of 205 upregulated lncRNAs (red), 277 downregulated lncRNAs (red), and 351 predicted miRNAs (green) together with their 1459 target genes (blue)

