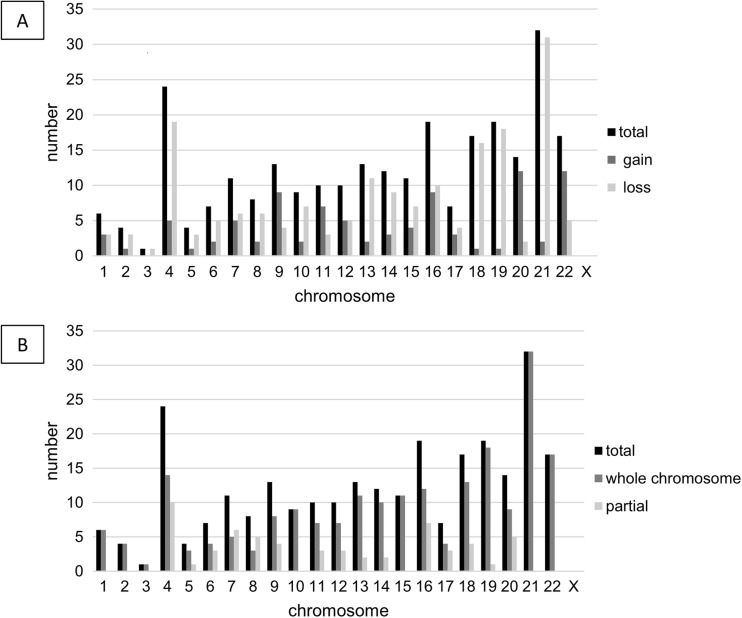
Fig. 3.
Aneuploidy screening. a) Distribution of chromosomes 1–22 and chromosome X, respectively, in respect to the individual gains and losses, resulting from the array CGH analysis. b) Distribution of chromosomal aberrations is displayed in respect to which part of the chromosome is concerned or if the whole chromosome is affected

