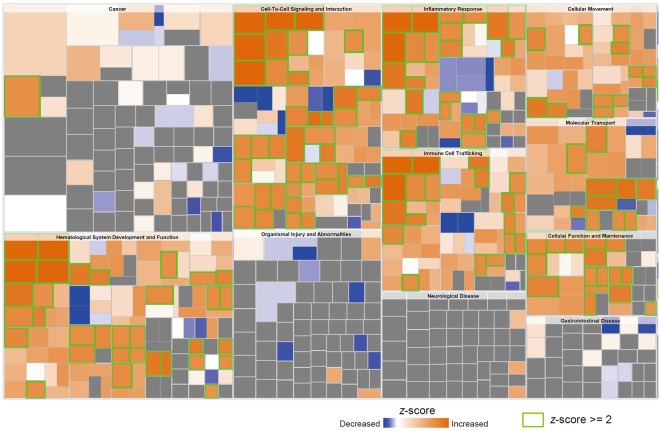
Figure 3.
Prediction of functions in HUVECs treated with exosomes released from PK-45H cells. The effects on the functions in treated HUVECs were examined by analysis of the ‘disease and functions’ of the IPA system. Size and colour are shown by the −log (P-value) or z-score, respectively. Orange and blue colours in the heat map indicate higher and lower z-scores, respectively. Green scale represents ‘Increased (z-score > 2.000)’ functions. The category data for 75 ‘increased (z-score > 2.000)’ and 1 ‘decreased (z-score < −2.000)’ are shown in Supplementary Table S3. The category of ‘cell-to-cell signalling and interaction’ included a number of ‘increased (z-score > 2.000)’.

