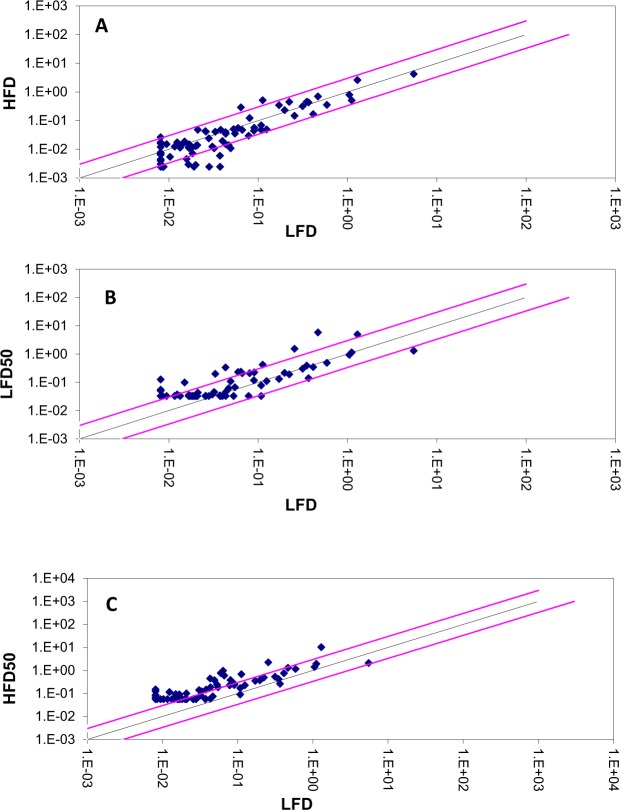
Figure 2.
Presents change in the expression of autophagy genes. The Scatter Plot graphs show the expression level () of each gene in the control sample versus the test sample. The black line indicates fold changes () of 1. The pink lines indicate the desired fold-change in gene expression threshold. (A) Changes in expression of autophagy genes in HFD treated groups. (B) Changes in expression of autophagy genes in LFD − As treated groups. (C) Changes in expression of autophagy genes in HFD − As treated groups.

