Fig. 3.
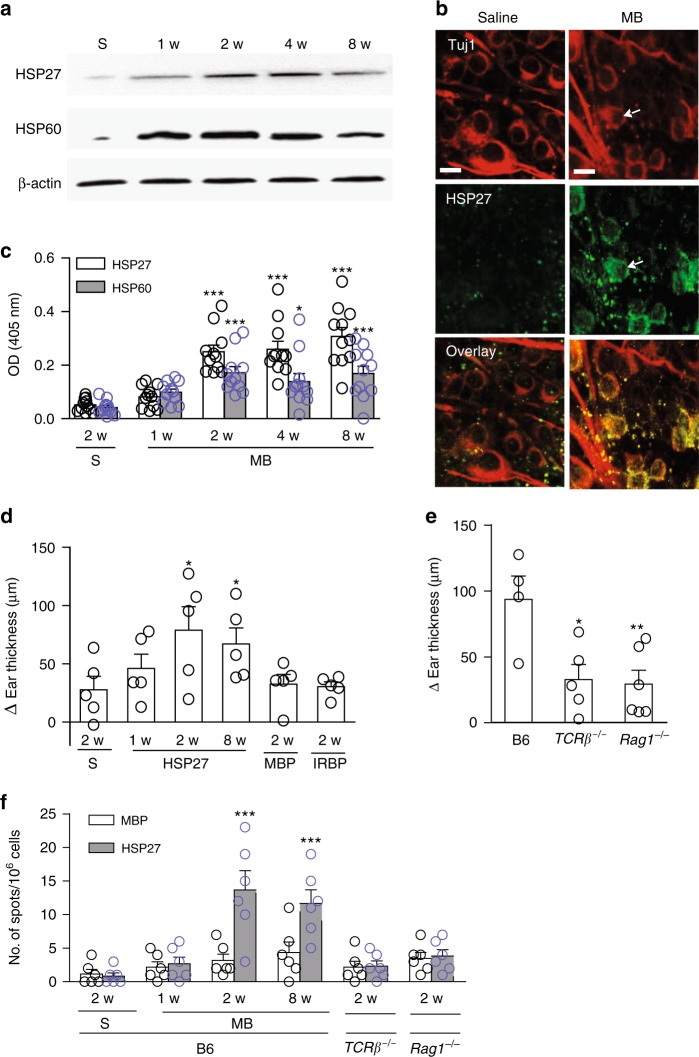
Elevated IOP stimulates T-cell responses to HSPs. a Induction of HSP27 and HSP60 expression in the retinas following MB injection. B6 mice were injected with MB or saline and 1, 2, 4, and 8 weeks later retinas were harvested and homogenized. Cell homogenates were fractionated on SDS-PAGE and blotted with anti-HSP27, anti-HSP60, and anti-β-actin. Shown are representative western blots. b Upregulation of HSP27 in the glaucomatous retina. Retinal flat-mounts were stained with Tuj1 (red) and anti-HSP27 (green). Shown are representative epifluorescence photomicrographs taken from mice 4 weeks post injection of saline or MB. Note the extracellular and membrane-associated HSP27 signals in the MB-injected retina. Scale bar: 10 μm. c ELISA quantification of serum levels of antibodies specific for HSP27 or HSP60 in B6 mice 1, 2, 3, and 4 weeks after MB injection or 2 weeks after saline (S) injection. *P < 0.05, ***P < 0.001 by ANOVA comparing to saline-injected group (n = 10/group). d, e DTH assays for T-cell responses to HSP27. Shown are ear thickness among B6 mice under indicated conditions (d) or among B6, Rag1−/−, and TCRβ−/− mice 2 weeks after MB injection were compared (e). B6, Rag1−/−, and TCRβ−/− mice were injected with saline or MB in the anterior chamber of the eye. One, two, and eight weeks later mice were challenged with saline, HSP27, MBP, or IRBP, and ear thickness was measured 24 h later. *P < 0.05 by ANOVA compared to saline (d) or to HSP27 challenged B6 mice (e) (n ≥ 4/group). f Frequencies of HSP27-specific T-cell responses. B6, Rag1−/−, and TCRβ−/− mice were injected with saline or MB in the anterior chamber of the eye. One, two, and eight weeks later splenocytes were stimulated with HSP27 or MBP and the frequencies of IFN-γ-secreting cells were measured by ELISPOT. ***P < 0.001 by ANOVA as compared to saline- and MB-injected mice (n ≥ 6/group)

