Figure 5.
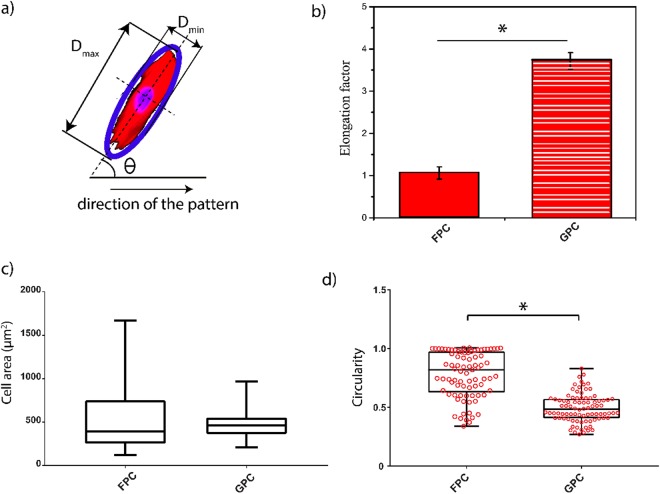
Cell morphometric analysis. Sketch of cell morphology and orientation along the collagen stripe (a). Dmax and Dmin are the long and short axis, θ the angle of orientation of the cells. Cell elongation is quantitatively evaluated through the elongation factor (b). A significant elongation between the two types of samples is evident in (b). Box plots of cell areas (c) and scatter box plots of circularity distributions (d) are shown in the bottom panel. A significant difference was found in cell circularity between cells seeded on FPC and GPC. Notes: *p < 0.005, each box has its ends at the quartiles, and the band within the boxes is the median of the distribution ((c), (d)).

