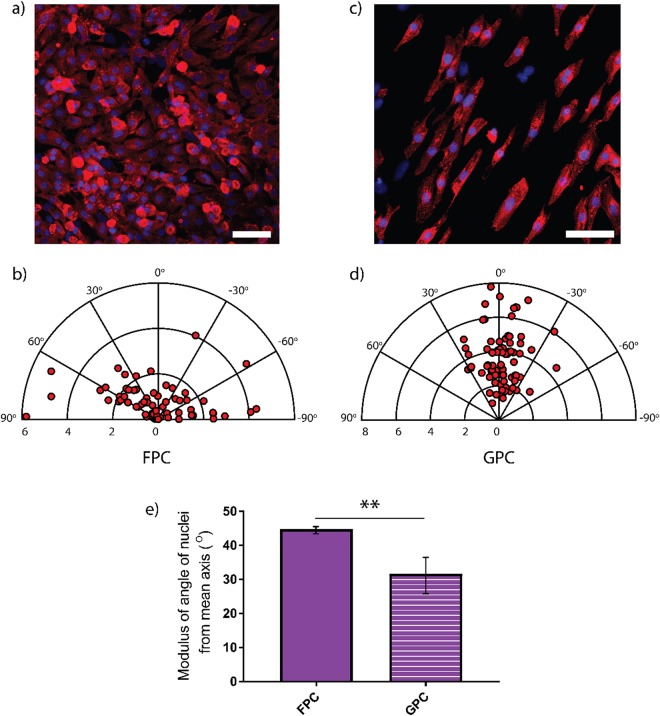
Figure 6.
Immunofluorescent staining images, analysis of cell and nuclei alignment on FPC and GPC. Representative immunofluorescence staining of sarcomeric α-actinin (red) and nuclei stained with DAPI (blue) on FPC (a) and GPC (c). Relative polar plots of the orientation angle of cells on FPC (c) and GPC (d) are also reported. In this polar plot the distance from the origin, R, is the elongation factor, each point is a single cell (81 cells for FPC and 85 cells for GPC) and the angle to the horizontal, θ, is the angle the long axis of the cell makes with the reference axis. In (e) is shown the modulus of the angle of nuclei alignment on uniformly covered and collagen-patterned polyacrylamide with **p < 0.01.

